Geoscience Reference
In-Depth Information
radiocarbon calibration curve for radiocarbon dating data calibrating. The
interpolated pollen percentages for individual taxa were obtained for each 500-year
interval between 22 cal. thousand years (ka) before present (BP) and 0 cal. ka BP
using the linear integration function of AnalySeries 2.0.4.2. The distributions and
qualities of these available pollen records were presented using ArcMap 10. Pa-
leoclimate records covering the past 18 cal. ka BP were collected from monsoonal
Central Asia (Wang et al.
2010
). After recalibrating radiocarbon ages, semi-quan-
titative climate indices for moisture and temperature were calculated in 100-year
intervals for the Holocene and 200-year intervals for the late glacial period. Prin-
cipal component analysis was applied using the moisture index covering the last
10 cal. ka BP to examine the climate patterns.
3 Key Findings
Climate change: Reconstructions reveal strong spatial heterogeneity in Holocene
moisture evolution within the Asian monsoon region. In the Indian monsoon
domain, moisture levels are highest during the early Holocene while many records
from the East Asian monsoon region (particularly north-central China) do not reach
maximum wetness until mid-Holocene (Wang et al.
2010
). For the early and mid-
Holocene time-slices, the high-resolution climate model results are qualitatively in
good agreement with the reconstructions (6k: Dallmeyer et al.
2013
): Both show
wetter conditions in the Indian monsoon region and a spatially inhomogeneous
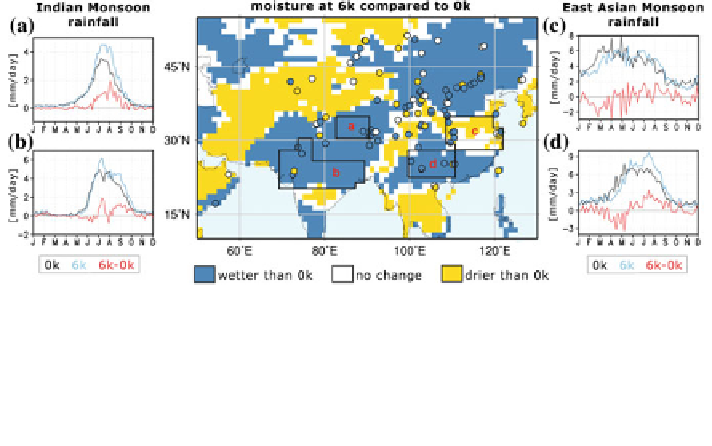
pattern of precipitation change in the East Asian monsoon region (Fig.
1
).
Fig. 1 Map: Simulated (shaded) and reconstructed (dots) mid-Holocene (6k) moisture difference
to pre-industrial level (0k) adapted to a 3-scale moisture index that categorize the mid-Holocene
climate in
'
wetter than 0k
'
,
'
drier than 0k
'
and
'
similar as 0k
'
, i.e., no change (absolute value of
relative precipitation difference less than 3 % in the model). Small figures a
-
d: climatological
annual precipitation cycle (mm/day) at mid-Holocene (blue), pre-industrial (black) and mid-
Holocene minus pre-industrial (red) for different areas in the Indian (a, b) and East Asian monsoon
region (c, d). Please note the change in scales. For further details see Dallmeyer et al. (
2013
)
Search WWH ::

Custom Search