Geology Reference
In-Depth Information
now possible to apply a time correction to each trace in
the VSP section, based on the travel time of the downgo-
ing direct event, in order to predict the form of seismic
trace that would be obtained at surface (Fig. 4.45(b)). By
stacking these traces within a time corridor that avoids
the multiple events, it is possible to produce a stacked
trace containing only primary reflection events. Com-
parison of this stacked trace with a conventional seismic
section from the vicinity of the borehole (Fig. 4.46) en-
ables the geological content of the latter to be identified
reliably.
4.14 Interpretation of seismic reflection data
Differing procedures are adopted for the interpretation
of two- and three-dimensional seismic data. The results
of two-dimensional surveys are presented to the seismic
interpreter as non-migrated and migrated seismic sec-
tions, from which the geological information is extract-
ed by suitable analysis of the pattern of reflection events.
Interpretations are correlated from line to line, and the
reflection times of picked events are compared directly at
profile intersections. There are two main approaches to
the interpretation of seismic sections:
structural analysis
,
which is the study of reflector geometry on the basis
of reflection times, and
stratigraphical analysis
(or
seismic
stratigraphy
), which is the analysis of reflection sequences
as the seismic expression of lithologically-distinct depo-
sitional sequences. Both structural and stratigraphical
analyses are greatly assisted by
seismic modelling
, in which
theoretical (synthetic) seismograms are constructed for
layered models in order to derive insight into the physi-
cal significance of reflection events contained in seismic
sections.
In the interpretation of three-dimensional survey
data, the interpreter has direct access at a computer work
station to all the reflection data contained within the
seismic data volume (see Section 4.10), and is able
to select various types of data for colour display, for
example vertical sections or horizontal sections (time
slices) through the data volume.The two most important
shortcomings of two-dimensional interpretation are
the problem of correlation between adjacent profile
lines and the inaccuracy of reflector positioning due to
the limitations of two-dimensional migration. The im-
proved coverage and resolution of three-dimensional
data often lead to substantial improvements in interpre-
tation as compared with pre-existing two-dimensional
interpretation. As with two-dimensional interpretation,
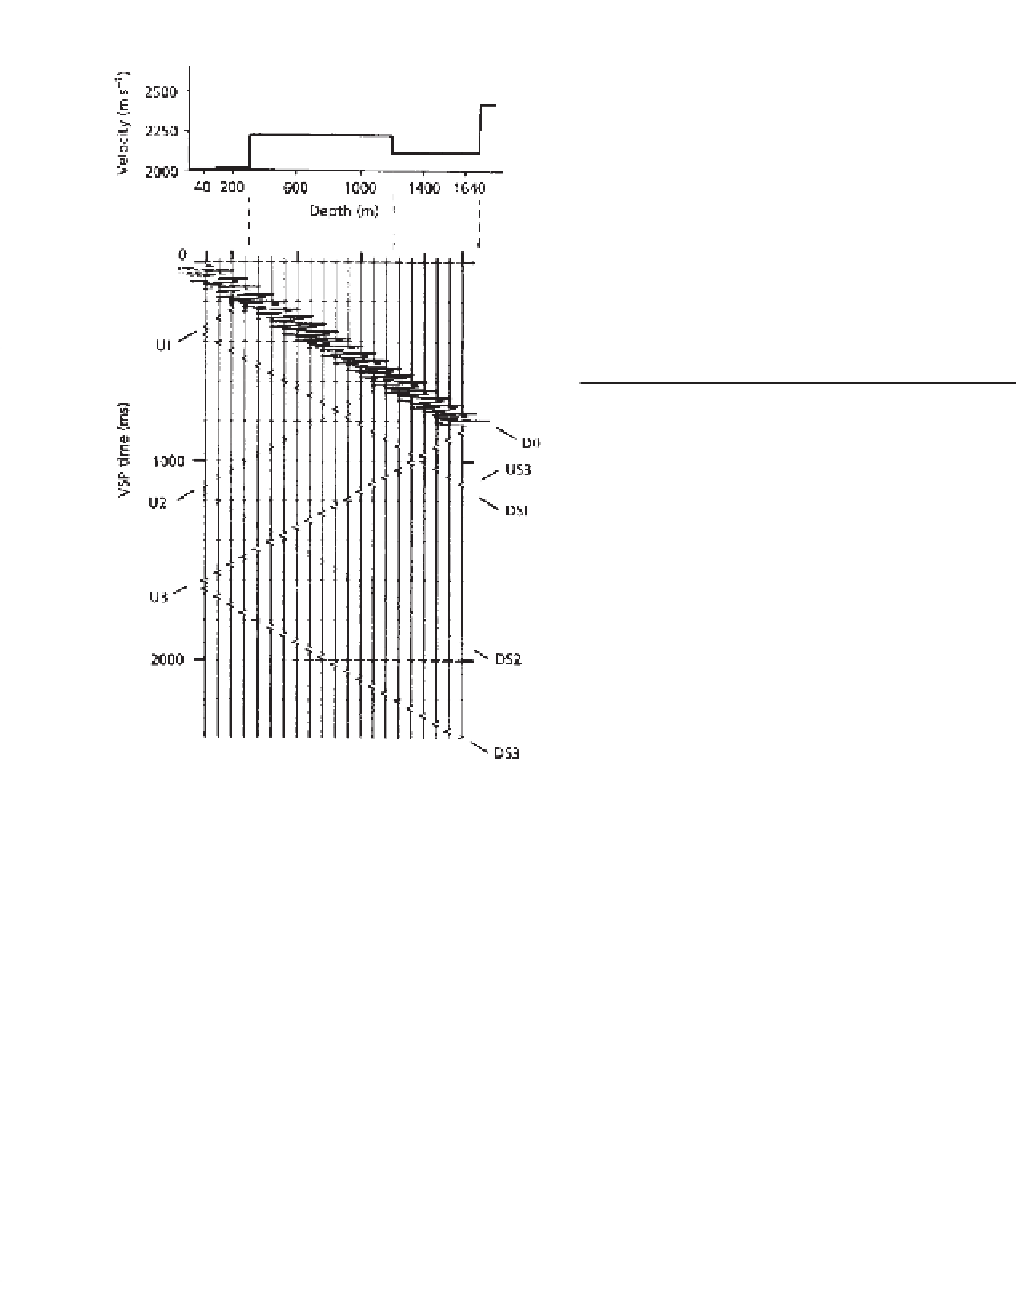
Fig. 4.44
A synthetic zero-offset VSP record section for the
velocity-depth model shown.The individual traces are recorded
at the different depths shown. D0 is the direct downgoing wave;
DS1, DS2 and DS3 are downgoing waves with multiple
reflections between the surface and interfaces 1, 2 and 3
respectively. U1, U2 and U3 are primary reflections from the
three interfaces; US3 is a reflection from the third interface with
multiple reflection in the top layer. (From Cassell 1984.)
ing and upgoing events to produce aVSP section retain-
ing only upgoing, reflected arrivals.The opposite dip of
the two types of event in the original VSP section enables
this separation to be carried out by
f
-
k
filtering (see Sec-
tion 4.8.3). Figure 4.45(a) illustrates a synthetic VSP sec-
tion after removal of downgoing events.The removal of
the stronger downgoing events has enabled representa-
tion of the upgoing events at enhanced amplitude, and
weak multiple reflection events are now revealed. Note
that these terminate at the same depth as the relevant
primary event, and therefore do not extend to the point
of intersection with the direct downgoing event. It is