Geology Reference
In-Depth Information
Shot lines
Recording
lines
Time
slice
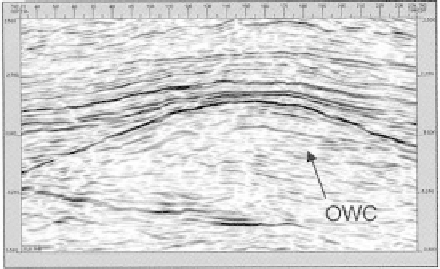
Fig. 4.39
Seismic section from a 3D data volume showing the
horizontal reflector produced by the oil-water contact.This is
clearly distinguishable from the reflections from geological
formations due to its strictly horizontal nature. Example from the
Fulmar field, UK North Sea. (From Jack 1997.)
Section
along
shot
line
Random
section
tions. This can be measured fully by having three geo-
phones at each location, oriented mutually at right
angles, and each recording one component. Thus three
components of the ground motion are recorded, giving
the method its name. Often these are labelled as having
their sensitive axes oriented to vertical, north-south and
east-west, though any set of orthogonal components is
sufficient. In this case the true ground motion is fully
recorded, and can be analysed in detail.
The three component (3C) technique requires three
times as many recording sensors, and more stages of data
analysis than vertical component recording.With devel-
oping technology, the additional sophistication of the
field equipment (Fig. 4.40) and the availability of large
computing power for the data analysis have made 3C
recording practicable. In fact, 3C data recording is
becoming increasingly common, and is now a routine
operation in the exploration for hydrocarbons.
The analysis of 3C data provides two major benefits.
These are the ability to identify S-waves in addition to P-
waves in the same data, and the ability to perform more
sophisticated filtering to identify and remove unwanted
wave energy, whether from surface waves, or noise
sources. Naturally the improved filtering contributes
substantially to the ability to detect the separate P- and
S-waves. S-waves are generated at any interface where a
P-wave is obliquely incident (see Section 3.6.2). Thus,
any seismic data will always contain energy from both P-
and S-waves. With appropriate processing, principally
exploiting the different particle motions and velocities
of the two waves, the P-wave and S-wave energy can
be separated and analysed.
Section along
recording line
Fig. 4.38
The reflection data volume obtained from a three-
dimensional seismic survey. By taking vertical slices through this
data volume, it is possible to generate seismic sections in any
azimuthal direction; by taking horizontal slices (time slices), the
areal distribution of reflection events can be studied at any two-
way reflection time.
dimensional surveys is carried out at computer work sta-
tions using software routines that enable seismic sections
and time slices to be displayed as required. Automatic
event picking and contouring are also facilitated (Brown
1986).
On high-quality modern seismic data it is quite com-
mon to image the oil-water contact within a hydro-
carbon reservoir (Fig. 4.39), or the bright spot, a
particularly strong reflection, caused by the high reflec-
tion coefficient at the top of a gas-filled formation.
4.11 Three component (3C) seismic reflection
surveys
All the previous discussion has only considered seismic
recording using vertical geophones. These only record
one component of the total seismic wave motion.Verti-
cal geophones are chosen in preference since they are
most sensitive to vertically travelling P-waves. The
actual ground motion consists of movement in all direc-