Geology Reference
In-Depth Information
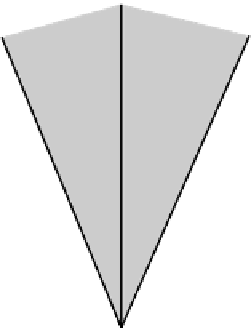
Hence, a plot of frequency
f
against apparent
wavenumber
k
a
for the pulse will yield a straight-line
curve with a gradient of
v
a
(Fig. 4.24). Any seismic event
propagating across a surface spread will be characterized
by an
f
-
k
curve radiating from the origin at a particular
gradient determined by the apparent velocity with
which the event passes across the spread. The overall set
of curves for a typical shot gather containing reflected
and surface propagating seismic events is shown in Fig.
4.25. Events that appear to travel across the spread away
from the source will plot in the positive wavenumber
field; events travelling towards the source, such as
backscattered rays, will plot in the negative wavenumber
field.
It is apparent that different types of seismic event
fall within different zones of the
f
-
k
plot and this fact
provides a means of filtering to suppress unwanted events
on the basis of their apparent velocity.The normal means
by which this is achieved, known as
f
-
k
filtering, is to
enact a two-dimensional Fourier transformation of the
seismic data from the
t
-
x
domain to the
f
-
k
domain, then
to filter the
f
-
k
plot by removing a wedge-shaped zone
or zones containing the unwanted noise events (March
& Bailey 1983), and finally to transform back into the
t
-
x
domain.
An important application of velocity filtering is
Surface
v
/sin
a
a
v
Apparent wavenumber
k
a
Fig. 4.23
A wave travelling at an angle
a
to the vertical will pass
across an in-line spread of surface detectors at a velocity of
v
/sin
a
.
Fig. 4.24
An
f-k
plot for a seismic pulse passing across a surface
spread of detectors.
Reflected events (signal)
f
Back-scattered
noise
High-velocity
noise
Ground
roll
Fig. 4.25
An
f-k
plot for a typical shot
gather (such as that illustrated in Fig. 4.8)
containing reflection events and different
types of noise.
-k
a
k
a