Geology Reference
In-Depth Information
40
0
-40
0
25 m
-80
180
-120
m
V
Schist
V
V
V
V
V
V
V
V
V
150
V
V
V
V
V
Sulphide
V
V
V
V
V
V
V
Fig. 8.37
The SP anomaly over a sulphide
ore body at Sariyer,Turkey. (AfterYüngül
1954.)
V
V
V
V
V
V
V
V
V
Andesite
V
120
posits when used in conjunction with magnetic, electro-
magnetic and geochemical techniques. It has also been
used in hydrogeological investigations (e.g. Fournier
1989), geothermal prospecting (Apostolopoulos
et al
.
1997) and the detection of air-filled drainage galleries
(Ogilvy
et al
. 1991).
Figure 8.37 shows the SP profile over a sulphide ore
body in Turkey which contains copper concentrations of
up to 14%.The SP anomaly is negative and has an ampli-
tude of some 140 mV. The steep topography has dis-
placed the anomaly minimum downhill from the true
location of the ore body.
Problems
10
1.
Using the method of electrical images, derive
the relationship between apparent resistivity,
electrode spacing, layer thicknesses and resistiv-
ities for a VES performed with a Schlumberger
spread over a single horizontal interface
between media with resistivities
r
1
and
r
2
.
2.
At locations A, B, C and D along the gravity
profile shown in Fig. 8.38, VES were performed
with a Wenner array with the spread laid perpen-
dicular to the profile. It was found that the sound-
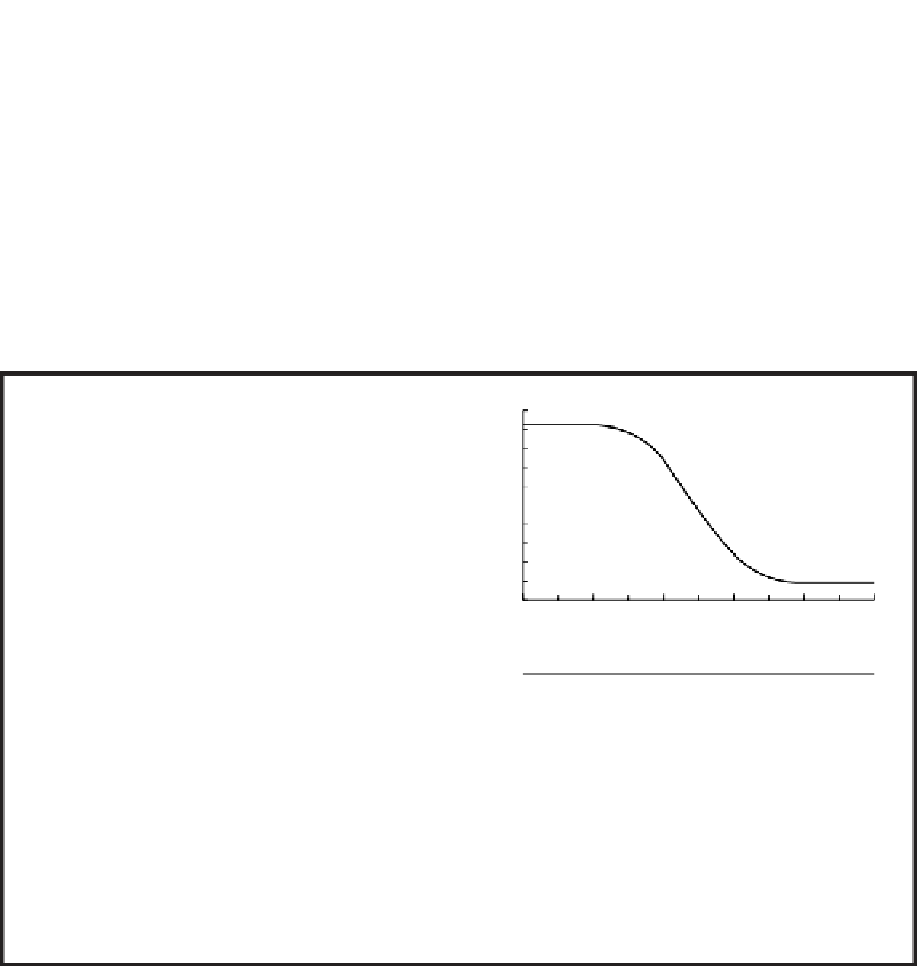
ing curves, shown in Fig. 8.39, were similar for
locations A and B and for C and D. A borehole
close to A penetrated 3 m of drift, 42 m of lime-
stone and bottomed in sandstone. Downhole
geophysical surveys (Chapter 11) provided the
values of resistivity (
r
R
) and density (
r
D
) shown in
the table for the lithologies encountered.
8
6
4
2
0
0
200
400
600
800
1000
Distance (m)
A
B
C
D
Fig. 8.38
Gravity anomaly profile pertaining to Question 2
showing also the locations of theVES at A, B, C and D.
Unit
r
R
(
W
m)
r
D
(Mg m
-
3
)
Drift
40
2.00
Limestone
2000
2.75
Sandstone
200
2.40
Continued


