Geology Reference
In-Depth Information
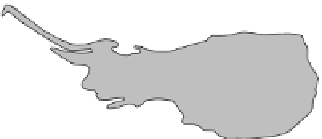
Bluff Limestone
Formation
N
81
°
20'
81
°
25'
Ironshore Formation
Fresh water lenses
1 Lower Valley Lens
2 Central Lens
3 East End Lens
19
25'
°
19
°
20'
2
3
1
0
4 km
Fig. 8.23
Simplified geology and
freshwater lenses of Grand Cayman. (After
Bugg & Lloyd 1976.)
a
(
Ω
m)
30.5
305
its relatively low density, fresh water tends to float on the
denser saline water which penetrates the limestone sub-
strate of the island from the sea. Figure 8.24 shows a fluid
conductivity profile from a borehole sunk in the Central
Lens compared with the results of aVES interpretation
from a sounding adjacent to the borehole. It is apparent
that fresh water can be distinguished from saline water by
its much higher resistivity.The resistivity survey took the
form of a series of VES which were interpreted using
the sounding by the borehole as control. Contours on
the base of the Central Lens, defined from these inter-
pretations, are shown in Fig. 8.25.A similar investigation
using resistivity to investigate the intrusion of saline
water into a coastal aquifer is given in Gondwe (1991).
Resistivity surveys can also be used to locate and mon-
itor the extent of groundwater pollution. Merkel (1972)
described the use of this technique in the delineation of
contaminated mine drainage from old coal workings in
Pennsylvania, USA. Figure 8.26 shows a geoelectric sec-
tion across part of the area, constructed from a series of
VES, and its geological interpretation which indicates
that no pollution is present. Figure 8.27 shows a further
geoelectric section from an adjacent area in which acid
mine drainage has increased the conductivity of the
groundwater, allowing its delineation as a band of low re-
sistivity. FurtherVES enabled the extent of the pollution
to be defined. Since contamination of this type is associ-
ated with a significant change in resistivity, periodic mea-
surements at electrodes sited in a borehole penetrating
the water table could be used to monitor the onset of pol-
lution and the degree of contamination. Ebraheem
et al
.
(b)
(a)
(c)
762
Ω
m
1
WT
359
Ω
m
Fresh
water
5
10
500 ppm
Transition
Zone
15
20
25
30
48
Ω
m
Saline
Fig. 8.24
(a) Vertical electrical sounding adjacent to a test
borehole in the Central Lens, Grand Cayman. (b) Layered model
interpretation of theVES. (c) Interpreted salinity profile. (After
Bugg & Lloyd 1976.)
number of exploratory boreholes required for both
essential aquifer tests and control of the geophysical
interpretation.
The resistivity method was used by Bugg and Lloyd
(1976) to delineate freshwater lenses in Grand Cayman
Island off the northern Caribbean (Fig. 8.23). Because of