Geology Reference
In-Depth Information
Site of
Hudsonian
trench
Observed
0
100 km
-200
-600
Computed
-1000
Dorset
Fold Belt
Granite
Belt
Thrust
Zone
gu
Lab
rador Trou
gh
0
Superior
Churchill
Nain
km
0.12
0.14
0.10
0.12
0.08
0.12
0.08
-0.28
-0.26
-0.30
-0.28
-0.32
-0.28
-0.32
-0.40
50
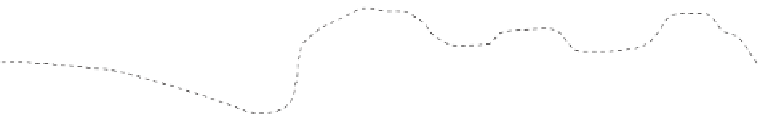
Fig. 6.26
Bouguer anomaly profile across a structural province boundary in the Canadian Shield. Density contrasts in Mg m
-3
. (After
Thomas & Kearey 1980.)
N
A'
10
0
0
Bodmin
Moor
Carnmenellis
100
A
0
St. Austell
Dartmoor
Land's
End
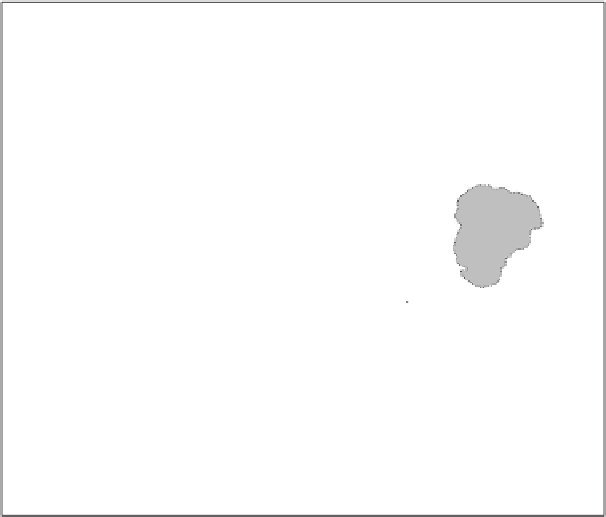
Fig. 6.27
Bouguer anomaly map of
southwest England, showing a linear belt
of large negative anomalies associated
with the zone of granite outcrops.
Contour interval 50 gu. (After Bott &
Scott 1964.)
Granite
0
30 km
another, more cost-effective method. An important
application of this type in mineral exploration is the
determination of ore tonnage by the excess mass
method described in Section 6.10.3.
Gravity surveying may be used in hydrogeological
investigations to determine the geometry of potential
aquifers. Figure 6.28 shows a Bouguer anomaly map of
an area near Taltal, Chile (Van Overmeeren 1975). The
region is extremely arid, with groundwater supply and
storage controlled by deep geological features.The grav-
ity minima revealed by the contours probably represent
two buried valleys in the alluvium overlying the grano-
dioritic bedrock. Figure 6.29 shows an interpretation of
a profile over the minima.The bedrock topography was
controlled by the results from a seismic refraction line
which had been interpreted using the plus-minus