Graphics Programs Reference
In-Depth Information
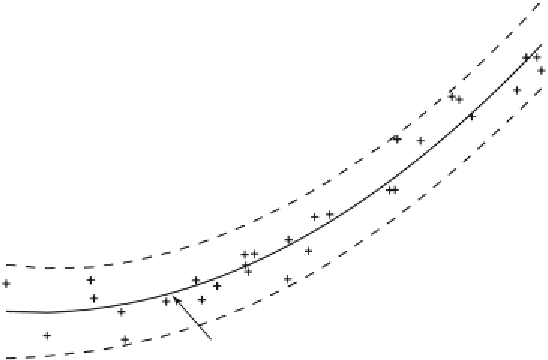
Curvilinear Regression
800
700
600
i-th data point
500
400
95% Confidence Bounds
300
200
100
95% Confidence Bounds
0
Regression line
ï
100
ï
200
0
2
4
6
8
10
12
14
16
18
20
Depth in sediment (meters)
Fig. 4.8
Curvilinear regression from barium contents. The plot shows the original data points
(plus signs), the regression line for a polynomial of degree
n
=2 (solid line) as well as the error
bounds (dashed lines) of the regression.
The plot nicely shows that the quadratic model for this data is a good one.
The quality of the result could again be tested by exploring the residuals,
employing resampling schemes or cross validation. The combination of re-
gression analysis with one of these methods represent a powerful tool in
bivariate data analysis, whereas Pearson·s correlation coeffi cient should be
used only as a fi rst test for linear relationships.
Recommended Reading
Alberède F (2002) Introduction to Geochemical Modeling. Cambridge University Press
Davis JC (2002) Statistics and data analysis in geology, third edition. John Wiley and Sons,
New York
Draper NR, Smith, H (1998) Applied Regression Analysis. Wiley Series in Probability and
Statistics, John Wiley & Son
Efron B (1982) The jackknife, the bootstrap, and other resampling plans. Society of