Graphics Programs Reference
In-Depth Information
Bivariate Scatter
Bivariate Scatter
120
20
r = 0.96
r = -0.97
0
100
−20
80
−40
60
−60
40
−80
20
−100
0
−120
0
5
10
15
20
0
5
10
15
20
x
x
a
b
Bivariate Scatter
Bivariate Scatter
20
r = 0.36
r = 0.95
15
15
Outlier
10
10
5
5
Random bivariate
data cluster
0
0
0
5
10
15
20
0
5
10
15
20
x
x
c
d
Bivariate Scatter
Bivariate Scatter
2500
600
r = 0.96
r = 0.38
2000
500
1500
400
1000
300
200
500
100
0
0
−500
0
5
10
15
20
−10
−5
0
5
10
x
x
e
f
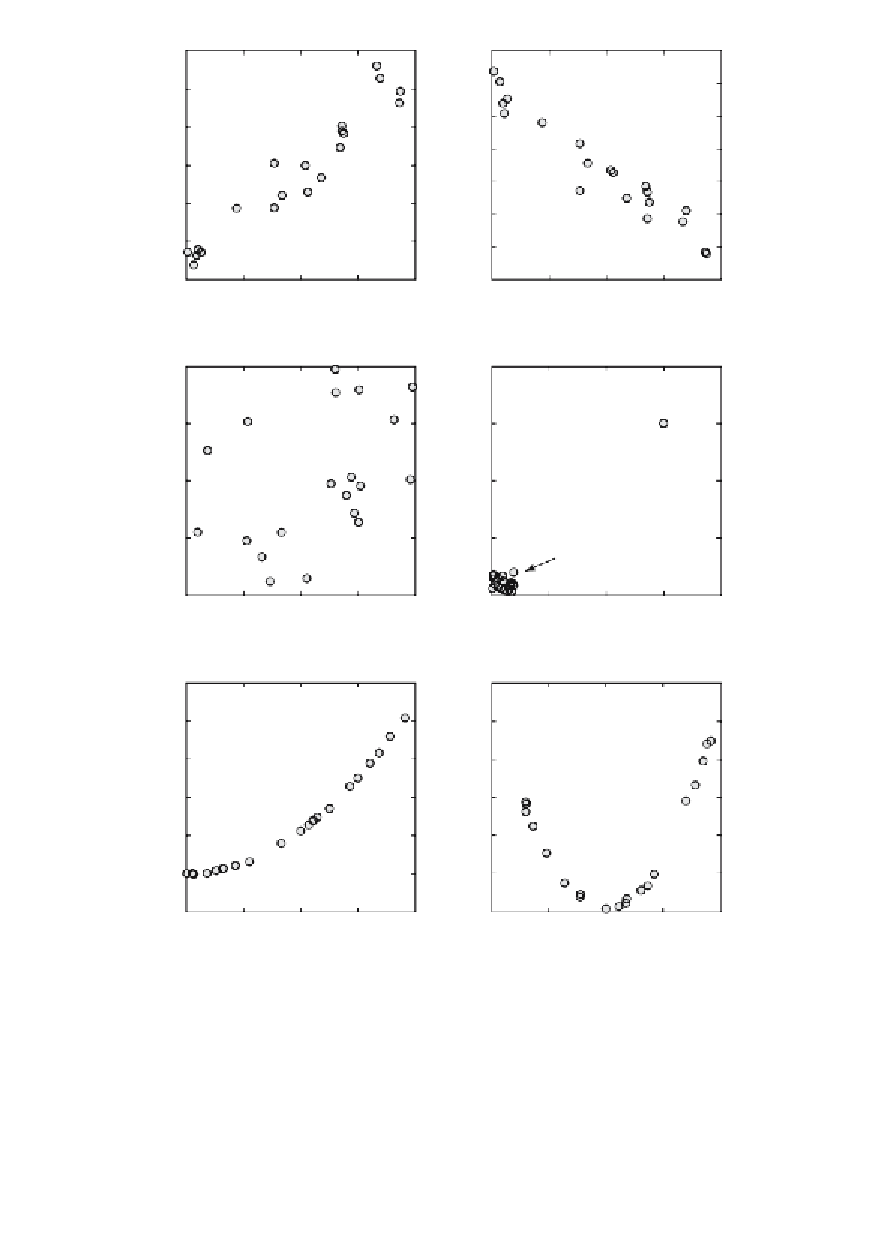
Fig. 4.2
Pearson·s correlation coeffi cent
r
for various sample data.
a-b
Positive and negative
linear correlation,
c
random scatter without a linear correlation,
d
an outlier causing a
misleading value of
r
,
e
curvilinear relationship causing a high
r
since the curve is close to a
straight line,
f
curvilinear relationship clearly not described by
r
.