Graphics Programs Reference
In-Depth Information
Probability Density
Function
Cumulative Distribution
Function
0.5
1
Φ=5
Φ=5
0.4
0.8
Φ=1
0.3
0.6
0.2
0.4
0.1
0.2
Φ=1
0
0
−6
−4
−2
0
2
4
6
−6
−4
−2
0
2
4
6
x
x
a
b
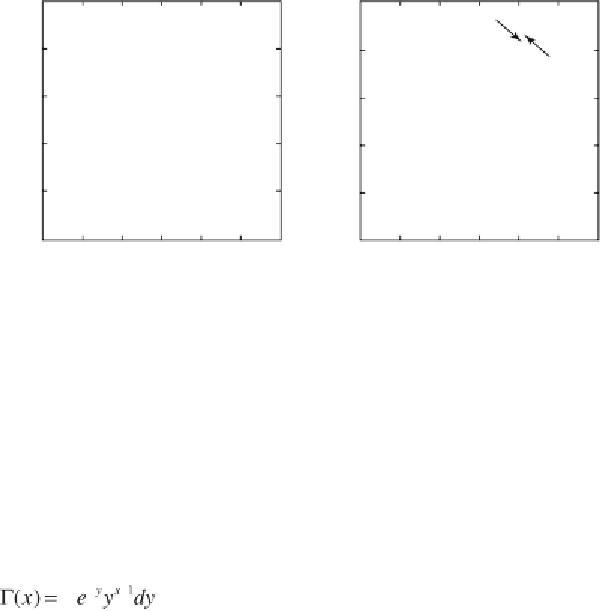
Fig. 3.9 a
Probability density function
f
(
x
) and
b
standardized (
F
(
x
)
max
=1) cumulative
distribution function
F
(
x
) of a Student·s t distribution with different values for Φ.
which can be written as
if
x
>0. The single parameter
of the t distribution is the degrees of freedom.
In the analysis of univariate data, this parameter is
Φ
Φ
=
n
-1, where
n
is the
sample size. As
|
, the t distribution converges to the standard normal
distribution. Since the t distribution approaches the normal distribution for
Φ
Φ
>30, it is not often used for distribution fi tting. However, the t distribution
is used for hypothesis testing, namely the t-test (Chapter 3.7).
Fisher
·
s F Distribution
The
F distribution
was named after the statistician Sir Ronald Fisher
(1890-1962). It is used for hypothesis testing, namely for the F-test
(Chapter 3.8) (Fig. 3.10). The F distribution was named in honor of the
statistician Sir Ronald Fisher. The F distribution has a relatively com-