Graphics Programs Reference
In-Depth Information
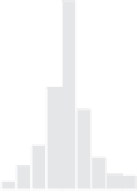
Negative Skewness
Positive Skewness
40
40
35
35
30
30
25
25
20
20
15
15
10
10
5
5
0
0
−2
0
2
4
6
8
−2
0
2
4
6
8
x
x
a
b
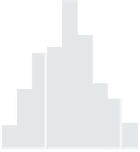
High Kurtosis
Low Kurtosis
80
100
70
60
80
50
60
40
30
40
20
20
10
0
0
0
0
0
0
6 8 0 2 4 6 8
x
x
c
d
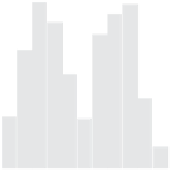
Bimodal Distribution
Trimodal Distribution
80
60
Mode 2
Mode 3
Mode 1
Mode 2
70
50
Mode 1
60
40
50
40
30
30
20
20
10
10
0
0
10
15
20
5
10
15
20
x
x
e
f
Fig. 3.3
Dispersion
and
shape
of a distribution.
a-b
Unimodal distributions showing a
negative or positive skew.
c-d
Distributions showing a high or low kurtosis.
e-f
Bimodal and
trimodal distribution showing two or three modes.