Graphics Programs Reference
In-Depth Information
Measures of Central Tendency
Parameters of central tendency or location represent the most important
measures for characterizing an empirical distribution (Fig. 3.2). These val-
ues help to locate the data on a linear scale. They represent a typical or best
value that describes the data. The most popular indicator of central tendency
is the
arithmetic mean
, which is the sum of all data points divided by the
number of observations:
The arithmetic mean can also be called the mean or the average of an uni-
variate data set. The sample mean is often used as an estimate of the popula-
tion mean
for the underlying theoretical distribution. The arithmetic mean
is sensitive to outliers, i.e., extreme values that may be very different from
the majority of the data. Therefore, the
median
as often used as an alterna-
tive measure of central tendency. The median is the
x
-value which is in the
middle of the data, i.e., 50% of the observations are larger than the median
and 50% are smaller. The median of a data set sorted in ascending order is
defi ned as
µ
Symmetric Distribution
Skew Distribution
15
50
Median
Mean Mode
Median
Mean
Mode
40
10
30
20
5
10
Outlier
0
0
8
10
12
14
16
0
2
4
6
8
x
x
a
b
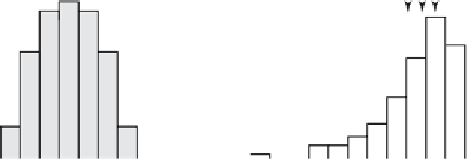
Fig. 3.2
Measures of
central tendency
.
a
In an unimodal symmetric distribution, the mean,
median and mode are identical.
b
In a skew distribution, the median is between the mean and
mode. The mean is highly sensitive to outliers, whereas the median and mode are not much
infl uenced by extremely high and low values.