Graphics Programs Reference
In-Depth Information
Correlation Matrix
+ 1.0
gal
sph
+ 0.5
flu
cla
0
qtz
ksp
pla
− 0.5
pyr
amp
− 1.0
amp
pyr
pla
ksp
qtz
cla
flu
sph
gal
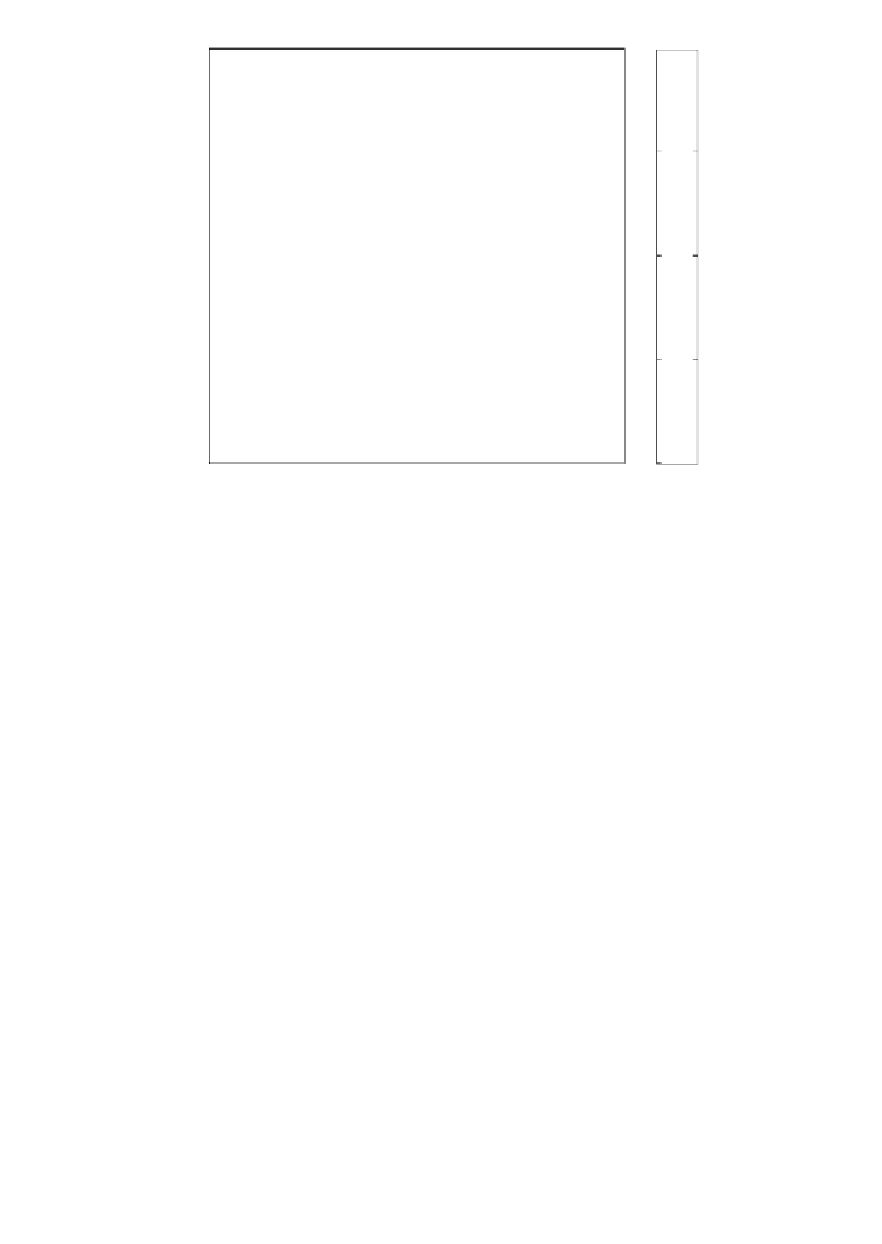
Fig. 9.2
Correlation matrix containing Pearson·s correlation coeffi cients for each pair of
variables, such as minerals in a sediment sample. Light colors represent strong positive
linear correlations, whereas dark colors document negative correlations. Orange suggests
no correlation.
PCA, such as
mean centering
(zero means) or
autoscaling
(mean zero and
standard deviation equals one). However, we use the original data for com-
puting the PCA. The output of the function
princomp
includes the principal
components
pcs
, the component scores of the data
newdata
and the com-
ponent
variances
.
[pcs,newdata,variances] = princomp(data);
The fi rst fi ve principal components PC
1
to PC
5
can be shown ty typing
pcs(:,1:5)
ans =
-0.3303 0.2963 -0.4100 -0.5971 0.1380
-0.3557 0.0377 0.6225 0.2131 0.5251
-0.5311 0.1865 -0.2591 0.4665 -0.3010
0.1410 0.1033 -0.0175 0.0689 -0.3367
0.6334 0.4666 -0.0351 0.1629 0.1794
0.1608 0.2097 0.2386 -0.0513 -0.2503
0.1673 -0.4879 -0.4978 0.2287 0.4756
0.0375 -0.2722 0.2392 -0.5403 -0.0068
0.0771 -0.5399 0.1173 0.0480 -0.4246