Graphics Programs Reference
In-Depth Information
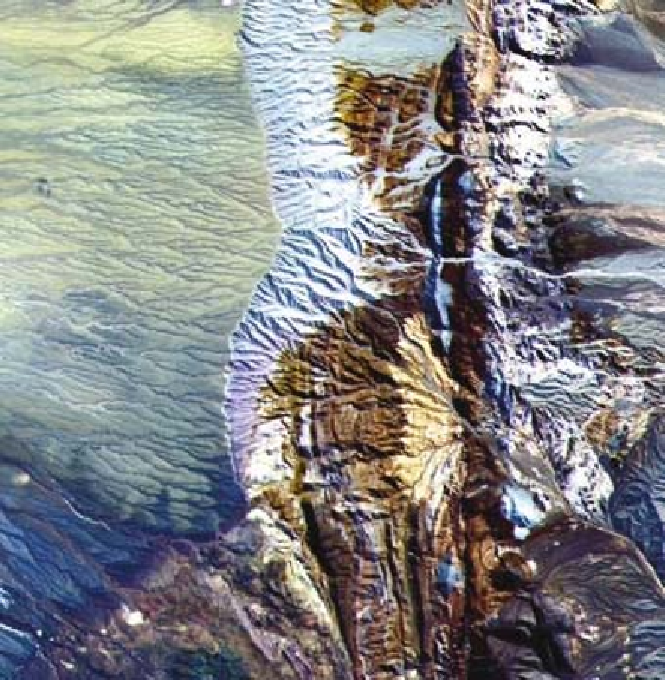
Fig. 8.1
RGB true color image contained in the fi le
unconform.jpg
. After decompressing and
reading the JPEG fi le into a 729x713x3 array, MATLAB interprets and displays the RGB
composite using the function
imshow
. See detailed description of the image on the NASA
TERRA-ASTER webpage http://asterweb.jpl.nasa.gov. Original image courtesy of NASA/
GSFC/METI/ERSDAC/JAROS and U.S./Japan ASTER Science Team.
data array. The colormap array is an
m
-by-3 array containing fl oating-point
values between 0 and 1. Each column specifi es the intensity of the colors
red, green and blue. The data array is an
x
-by-
y
array containing integer ele-
ments corresponding to the lines
m
of the colormap array, i.e., the specifi c
RGB representation of a certain color. Let us transfer the above RGB image
into an indexed image. The colormap of the image should contain 16 differ-
ent colors.
[x,map]=rgb2ind(unconform1,16);