Graphics Programs Reference
In-Depth Information
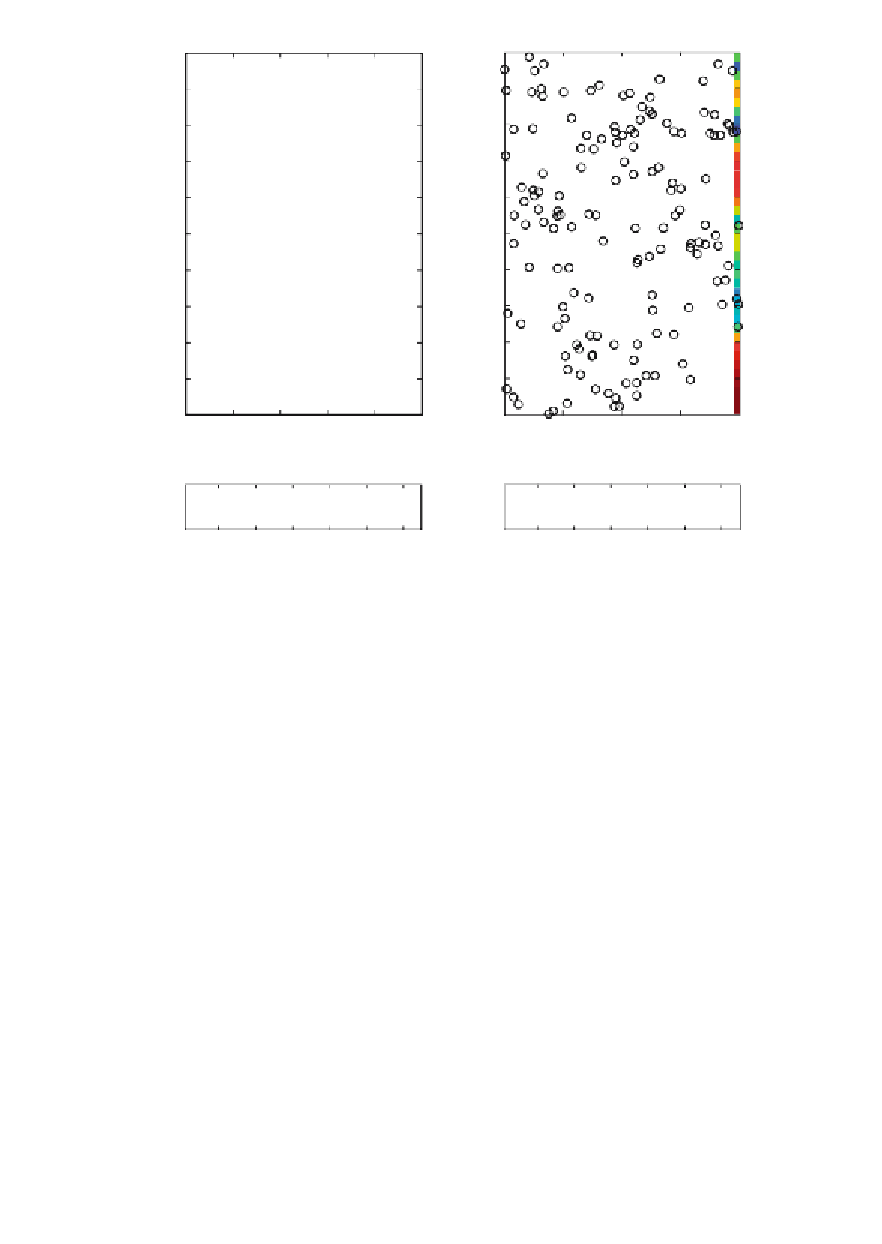
Kriging Estimate
Kriging Variance
200
1
180
0.9
0.8
160
0.7
140
0.6
120
100
0.5
80
0.4
60
0.3
0.2
40
20
0.1
0
0
0
0.2
0.4
0.6
0.8
1
0
50
100
150
200
x−coordinates
x−coordinates
10
20
30
40
50
60
10
20
30
40
50
60
a
b
Fig. 7.16
Interpolated values on a regular grid by ordinary point kriging using
a
an exponen-
tial variogram model;
b
kriging variance as a function of the distance from the observations
(empty circles).
Discussion of Kriging
Point kriging
as presented here is an exact interpolator. It reproduces ex-
actly the values at an observation point, even though a variogram with a
nugget effect is used. Smoothing can be caused by including the variance
of the measurement errors (see Kitanidis, 1997) and by
block kriging
which
averages the observations within a certain neighborhood (block). While
kriging variance only depends on the distance between the observed and
the unobserved locations it is primary a measure of density of information
(Wackernagel, 2003). The accuracy of kriging is better evaluated by cross-
validation using a resampling method or surrogate test (Chapter 4.6 and
4.7). The infl uence of the neighboring observations on the estimation de-
pends on their confi guration. Webster and Oliver (2001) summarize: Near
points carry more weight than more distant ones; the relative weight of a