Graphics Programs Reference
In-Depth Information
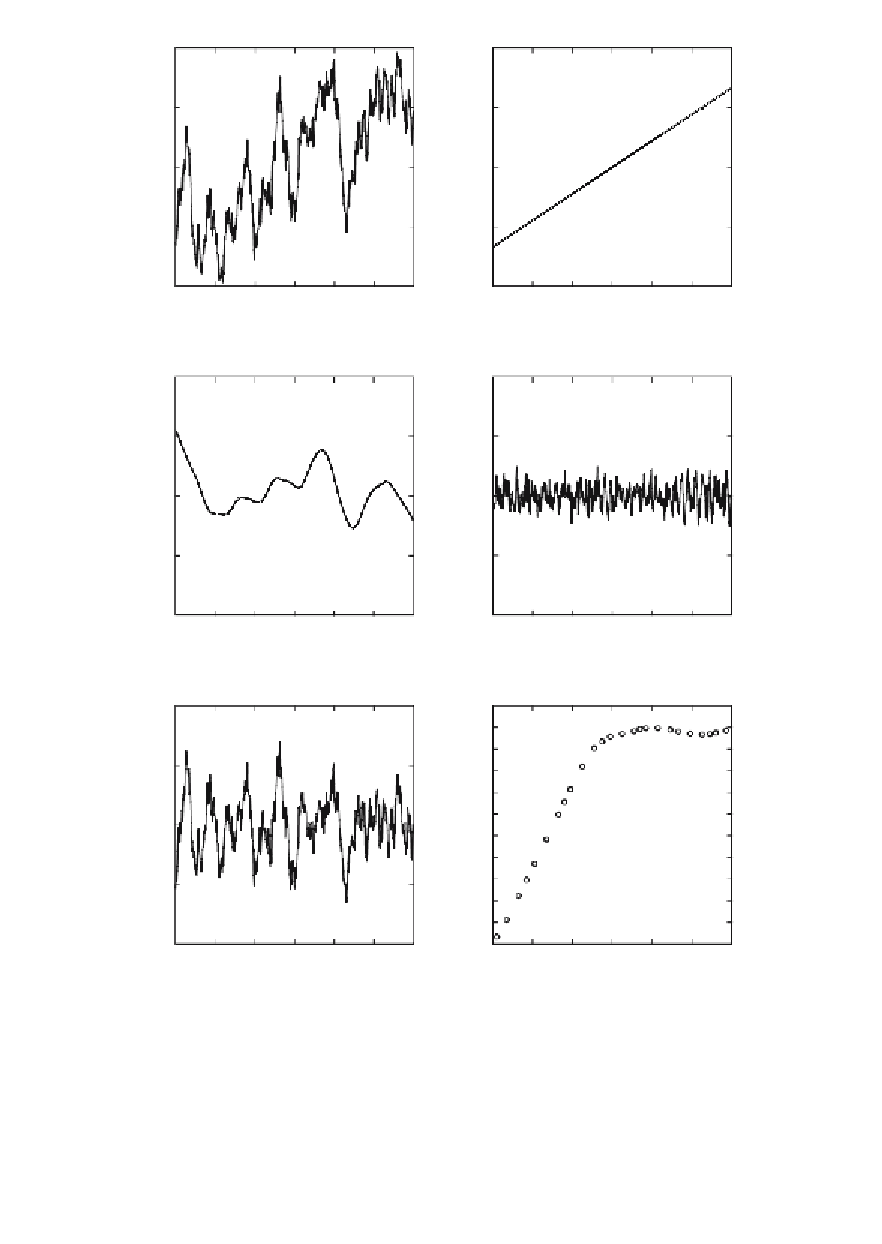
Spatiotemporal Process
Global Trend Component
3.0
3.0
1.5
1.5
0.0
0.0
-1.5
-1.5
-3.0
-3.0
0
100
200
300
400
500
600
0
100
200
300
400
500
600
x
x
a
b
Local Trend Component
Random Component
3.0
3.0
1.5
1.5
0.0
0.0
-1.5
-1.5
-3.0
-3.0
0
100
200
300
400
500
600
0
100
200
300
400
500
600
x
x
c
d
Autocorrelation Component
Variogram
3.0
1.0
1.5
0.8
0.6
0.0
0.4
-1.5
0.2
-3.0
0.0
0
100
200
300
400
500
600
0 0 0 0 0 0 0
x
Lag Distance
e
f
Fig. 7.10
Components of a spatiotemporal process and the variogram. The variogram (
f
)
should only be derived from the autocorrelated component.