Graphics Programs Reference
In-Depth Information
Highpass Filter
Lowpass Filter
P
assband
Passban
d
Tra
nsit
ion
Tr
ansiti
on
Stopband
Stopband
1.0
1.0
Cutoff
Frequency
Cutoff
Frequency
0.5
0.5
0
0
0
0.25
0.5
0.75
1.0
0
0.25
0.5
0.75
1.0
Frequency
Frequency
a
b
Bandpass Filter
Bandstop Filter
P
assban
d
Passba
nd
Passba
nd
Tra
nsit
ion
Tra
nsi
tion
Tra
nsit
ion
Tra
nsit
ion
Stopba
nd
Stopba
nd
St
opban
d
1.0
1.0
0.5
0.5
0
0
0
0.25
0.5
0.75
1.0
0
0.25
0.5
0.75
1.0
Frequency
Frequency
c
d
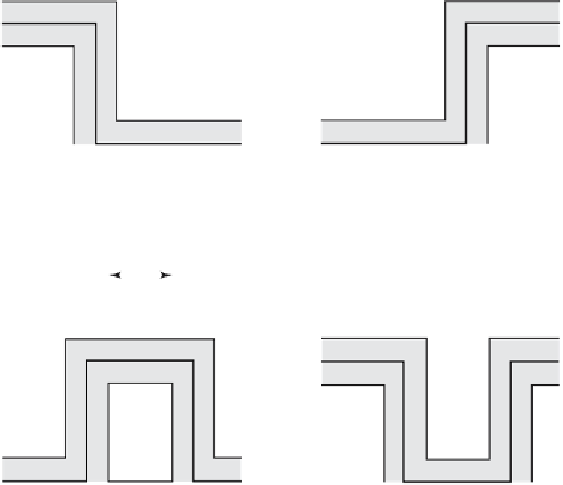
Fig. 6.5
Frequency response of the fundamental types of frequency-selective fi lters.
a
Lowpass fi lter to suppress the high-frequency component of a signal. In earth sciences, such
fi lters are often used to suppress high-frequency noise in a low-frequency signal.
b
Highpass
fi lter are employed to remove all low frequencies and trends in natural data.
c-d
Bandpass
and bandstop fi lters extract or suppress a certain frequency band. Whereas the solid line in
all graphs depicts the ideal frequency response of a frequency-selective fi lter, the gray band
shows the tolerance for a low-order design of such a fi lter. In practice, the frequency response
lies within the gray band. Higher-order fi lters allow to approximate the ideal line better than
low-order fi lters.
differences of causal vs. non-causal versions of the same fi lter. Filtering and
plotting the results clearly illustrates the effects of the fi lter.
xf12 = filtfilt(b12,a12,xn12);