Graphics Programs Reference
In-Depth Information
0
100
200
300
400
500
600
1.0
700
800
0.5
900
0.0
0
100
200
300
400
500
600
700
800
900
Time
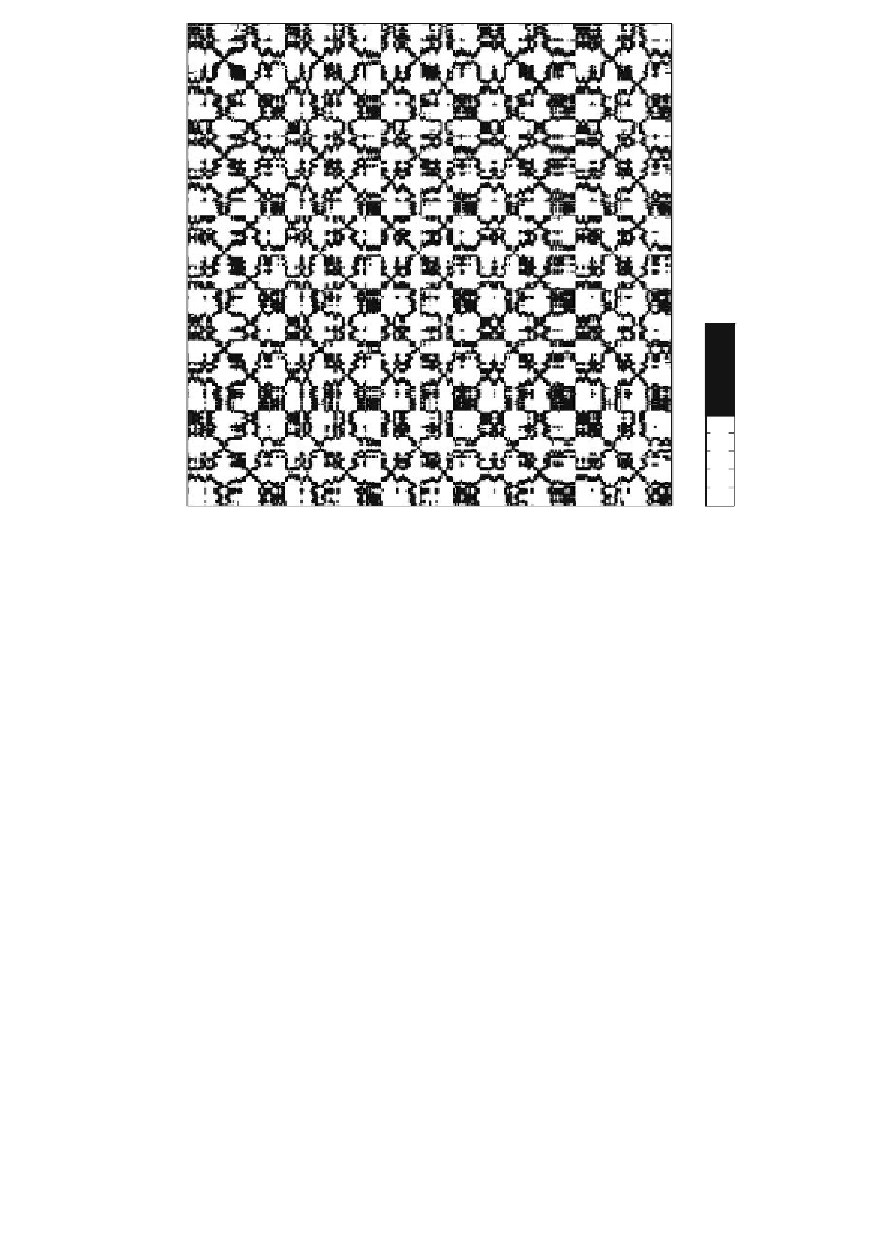
Fig. 5.16
Visualization of the recurrence plot after applying a threshold of ε=10 to the
distance matrix.
The analysis of recurrence plots has already been applied to many problems
in earth sciences. The comparison of the dynamics on modern precipitation
data with paleo-rainfall data inferred from annual-layered lake sediments in
the northwestern Argentine Andes provides a good example of such analy-
sis (Marwan et al. 2003). In this example, the method of recurrence plots
was applied to red-color intensity transects across ca. 30 kyr-old varved
lake sediments shown in Figure 5.1. Comparing the recurrence plots from
the sediments with the ones from modern precipitation data revealed that
the reddish layers document more intense rainy seasons during the La Niña
years. The application of linear techniques was not able to link the increased
fl ux of reddish clays and enhanced precipitation to either the El Niño or La
Niña phase of the ENSO. Moreover, recurrence plots helped to prove the
hypothesis that a longer rainy seasons, enhanced precipitation and stronger
infl uence of the El Niño/Southern Oscillation has caused enhanced landslid-
ing at 30 kyrs ago (Marwan et al. 2003, Trauth et al. 2003).