Environmental Engineering Reference
In-Depth Information
be linear on a semilog plot (i.e., slope of the normal com-
pression line).
to volumetric strain. The actual energy input into the soil was
computed based on values applicable at optimum water con-
tent. The results show a reasonable shape for the predicted
compaction curves.
Figure 2.51 shows the compaction curve for a sandy clay
soil with a liquid limit of 39% and a plasticity index of
15% (Kenai et al., 2006). Experimental results correspond
to a static pressure of 2100 kPa and a dynamic energy input
of 3000 kJ/m
3
. Both predicted compaction curves were pro-
duced using quasi-static compaction pressures of 2100 and
4000 kPa, respectively.
Compaction curves computed using undrained
K
o
load-
ing conditions appear to be similar to laboratory measured
results. Unsaturated soil mechanics theories appear to pro-
duce the familiar inverted parabolic shape for the com-
paction curve. A number of assumptions are necessary when
predicting the compaction curve. The controlling soil prop-
erty governing the compaction process appears to be the
coefficient of compressibility with respect to net applied
2.5.4 Comparison of Predicted and Measured
Compaction Curves
The performance of the compaction model has been demon-
strated by comparing predicted compaction curves with the
experimental results (Montanez, 2002; Kenai et al., 2006).
Figures 2.49 and 2.50 show compaction curves for sand-
bentonite mixtures with 5 and 15% bentonite content (by
weight). The specific gravity of the mixture was 2.66. Mon-
tanez (2002) used the standard Proctor test procedure with
an energy input of 637 kJ/m
3
). The compaction model pre-
dictions are also shown in Figs. 2.49 and 2.50.
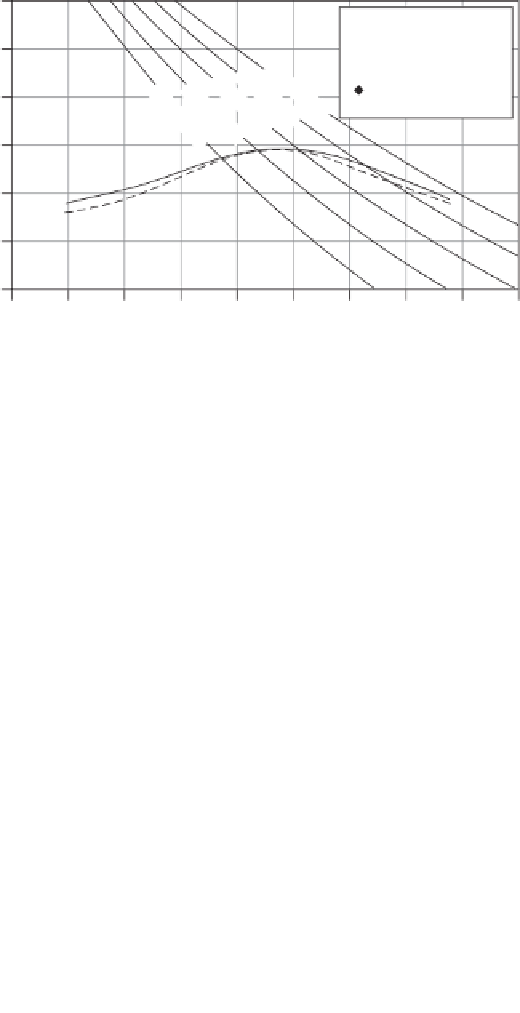
The curves shown as dashed lines represent static com-
paction curves predicted using the undrained model loading
up to an external quasi-static pressure of 637 kPa. The
curves shown as solid lines are for equal-energy input that
was calculated by integrating the applied stress with respect
2.2
Model prediction—
static (637 kPa)
Model prediction—
dynamic (16 kj/m
3
)
Experimental data
(637 kj/m
3
)
2.1
2.0
1.9
1.8
1.7
1.6
2
4
6
8
10
12
14
16
18
20
Water content, %
Figure 2.49
Comparison of the predicted and experimental compaction curves for well-graded
sand with 5% bentonite (data from Montanez, 2002).
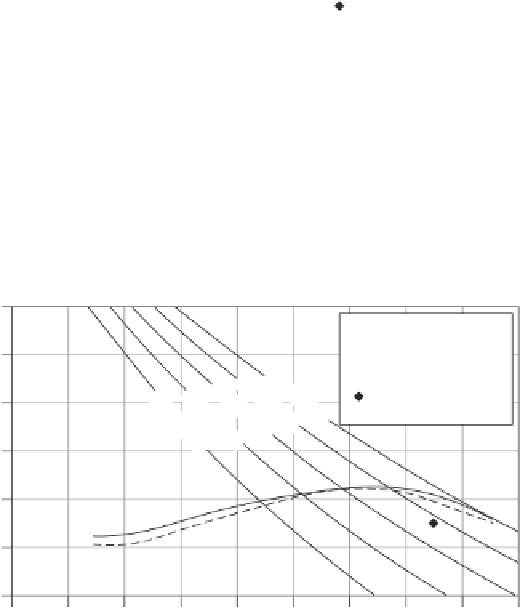
2.2
Model prediction—
static (637 kPa)
Model prediction—
dynamic (18 kj/m
3
)
Experimental data
(637 kj/m
3
)
2.1
2.0
1.9
1.8
1.7
1.6
2
4
6
8
10
12
14
16
18
20
Water content, %
Figure 2.50
Comparison of the predicted and experimental compaction curves for well-graded
sand with 15% bentonite (data from Montanez, 2002).


Search WWH ::

Custom Search