Environmental Engineering Reference
In-Depth Information
0
20
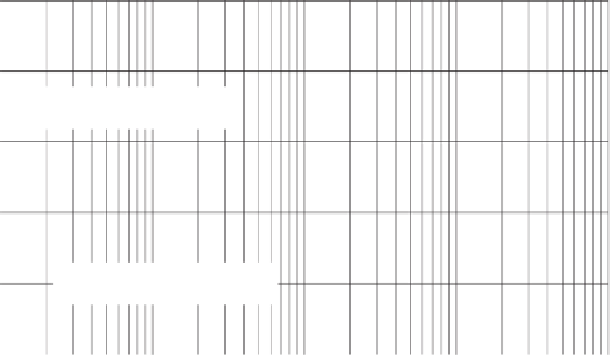
Theoretical curve
Experimental data
40
60
Coefficient of permeability
of water = 3.3 X 10
−
11
m/s
80
100
1
10
100
1000
10,000
Elapsed time (min)
Figure 16.67
Comparison of measured data to rheological simulation for percent consolidation
versus logarithm of time plot for compacted kaolin (Fredlund and Rahardjo, 1993a).
−
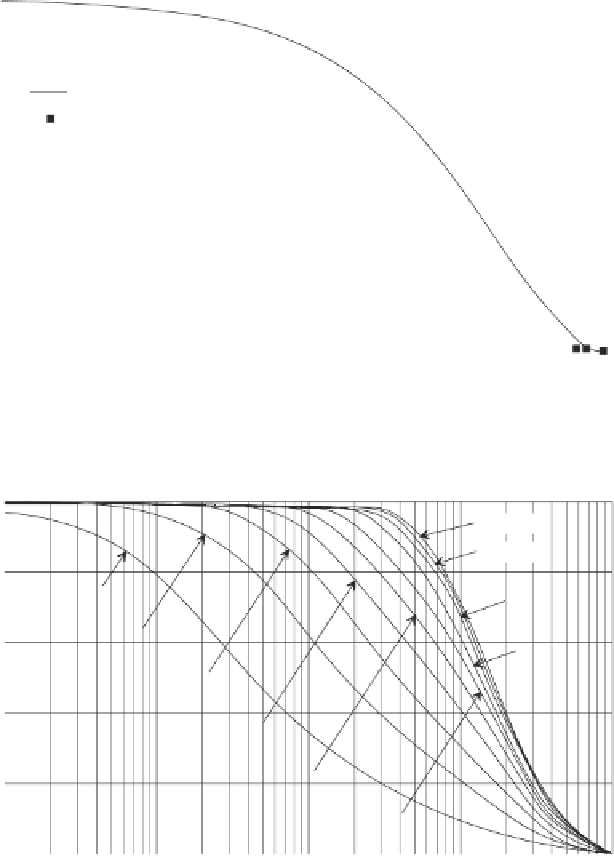
100
Layer 10
Layer 9
−
120
Layer 1
Layer 8
Layer 2
−
140
Layer 7
Layer 3
−
160
Layer 4
Layer 5
180
−
Layer 6
−
200
1
10
100
1000
10,000
Elapsed time (min)
Figure 16.68
Calculated pore-water pressures in kaolin using linear rheological model.
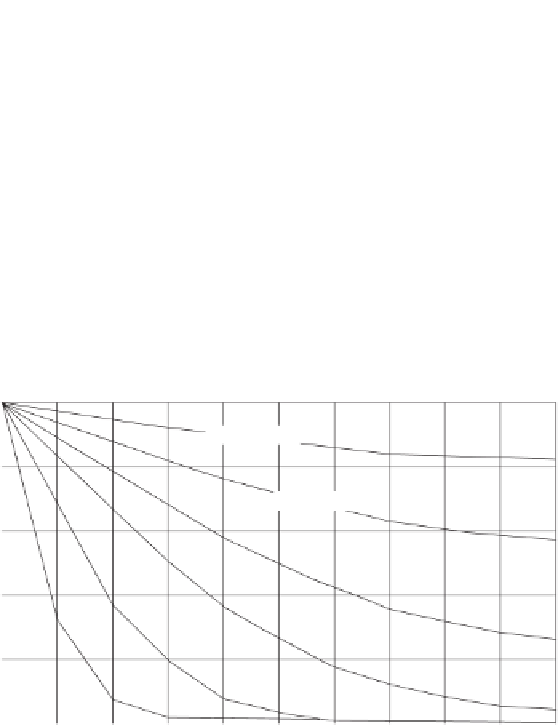
0
t
= 3747 min
20
t
= 2056 min
40
t
= 1021 min
60
t
= 415 min
t
= 20 min
80
t
= 307 min
100
1
2
3
4
5
6
7
8
9
10
Layer number (or depth into soil)
Figure 16.69
Percent consolidation for different layers in compacted kaolin calculated using
linear rheological model.


Search WWH ::

Custom Search