Environmental Engineering Reference
In-Depth Information
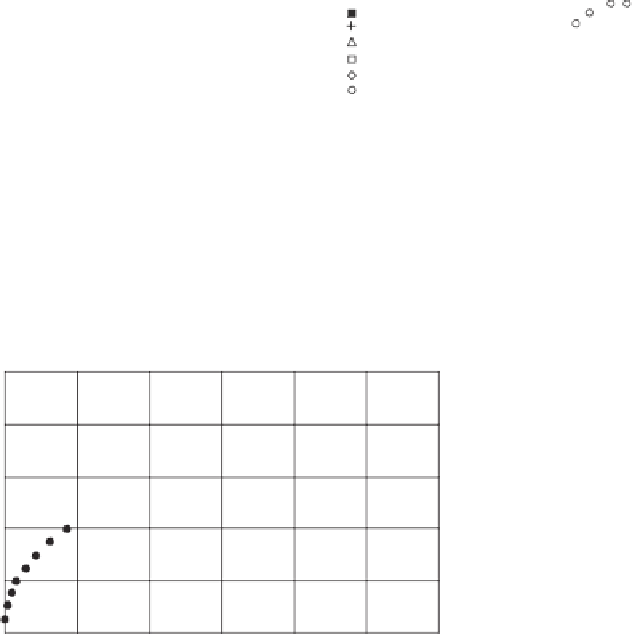
100
5500 min
80
1500 min
5300 min
60
40
, , - Measured (filter paper)
, , - Measured (SWCC)
, , - Computed
20
0
0
100
200
300
400
500
600
Matric suction (
u
a
-
u
w
) (kPa)
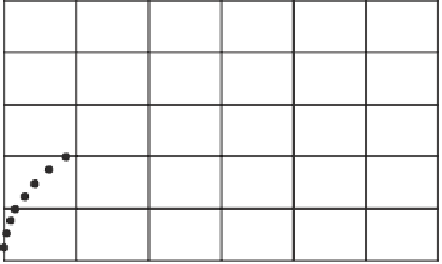
Figure 16.58
Computed and measured matric suction profiles for free-swell oedometer test.
300
100 mm (CVSM1)
100 mm (CVSM2)
100 mm (computed)
20 mm (CVT4)
20 mm (CVT5)
20 mm (computed)
20 mm
250
200
100 mm
150
100
50
0
0.1
1
10
100
1000
10,000
100,000
Time (min)
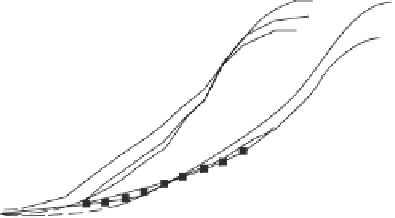
Figure 16.59
Computed and measured vertical normal stress-time curves for constant-volume
oedometer tests.
the unsaturated permeability function variables remained
unchanged. The saturated coefficients of permeability were
set to 4
.
0
100
5500 min
10
−
12
m/s. The
height of the specimen is 20 mm. The computed curves
presented in Fig. 16.61 show that the permeability of the soil
strongly influences the rate of swelling. The highest saturated
coefficient of permeability shows that it requires about
450min for the swelling pressure to be developed. In contrast,
a saturated coefficient of permeability of 4
.
0
10
−
10
,4
.
0
10
−
11
, and 4
.
0
×
×
×
80
1500 min
5300 min
60
40
10
−
12
m/s
shows that 42 days is required for the development of the
swelling pressure.
The effect of the drainage distance on the rate of devel-
opment of the swelling pressure is shown in Fig. 16.62.
The specimen that was only allowed access to water from
the bottom of the soil specimen took four times longer to
develop its swelling pressure than the specimen that had
access to water from the top and bottom sides of the speci-
men. Similar observations were made by Mesri et al. (1994)
for Taylor shale from Texas. It was assumed that there were
no difficulties associated with the confinement of air bub-
bles within the soil specimen when wetting occurred from
both the top and bottom of the specimen.
The free-swell model can also be used in a parametric
manner to study the influence of factors associated with
the test procedure. The influence of steady-state evaporation
×
, , Measured (filter paper)
, , Measured (SWCC)
, , Computed
20
0
0
100
200
300
400
500
600
Matric suction (
u
-
u
) (kPa)
aw
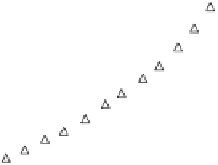
Figure 16.60
Computed and measured matric suction profiles for
constant-volume oedometer test.
16.10.3 Application of Numerical Swelling
Pressure Model
The proposed swelling model can be used to perform a
parametric study of factors which may influence the swelling
process. The influence of the coefficient of permeability on
the swelling process is shown in Fig. 16.61. Each curve
was calculated using a different value for the saturated
coefficient of permeability
k
s
while the other soil moduli and


Search WWH ::

Custom Search