Environmental Engineering Reference
In-Depth Information
0
0
2
4
2
−
1
−
6
−
8
−
2
0 mm
−
4
2
0
5
10
Distance (m)
15
20
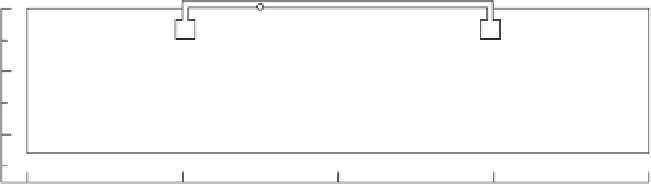
Figure 16.40
Distribution of horizontal displacements under steady-state conditions.
0
70
60
50
30
40
20
1
10 mm
2
0
5
10
Distance (m)
15
20
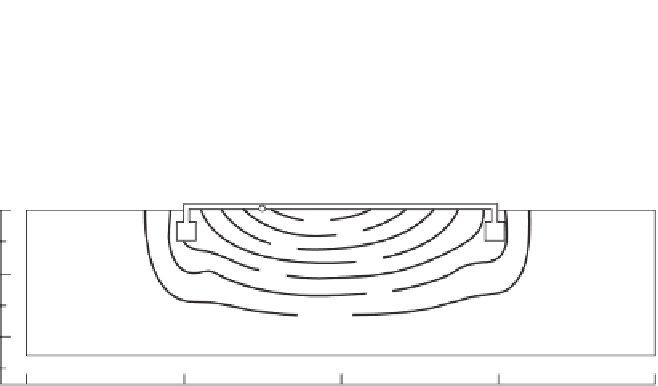
Figure 16.41
Distribution of vertical displacements under steady-state conditions.
kept unchanged at values representing the “median case.”
Table 16.7 shows the values of the parameters that were used
in the parametric study. The displacements were calculated
for the case of steady-state seepage.
Figures 16.42 and 16.43 present the predicted vertical dis-
placements at the surface of the slab and under the center of
the slab, respectively, for various values of Poisson's ratio.
The predicted total heave increases with an increasing value
for the assumed Poisson's ratio. For a change in Poisson's
ratio from 0.35 to 0.45, the variation in maximum total heave
predicted is about
the slab, respectively, for various values of swelling index
C
s
. The predicted total heave increases with increasing val-
ues for swelling index. For a change in swelling index from
0.085 to 0.095, the variation in the maximum total heave
predicted is about
5%.
Figures 16.46 and 16.47 present the predicted vertical dis-
placements at the surface of the slab and under the center of
the slab, respectively, for various values of initial void ratio.
The total heave predicted increases with decreasing values
for initial void ratio. For a change in initial void ratio vary-
ing from 0.92 to 1.00, the variation in maximum total heave
predicted is about
±
7%.
Figures 16.44 and 16.45 present the predicted vertical dis-
placements at the surface of the slab and under the center of
±
2%.
Figures 16.48 and 16.49 present the predicted vertical dis-
placements at the surface of the slab and under the center
of the slab, respectively, for various values of the coeffi-
cient of earth pressure at rest,
K
0
. The total heave predicted
increases with a decreasing value for the coefficient of earth
pressure at rest. For a change in the coefficient of earth pres-
sure at rest from 0.4 to 1.0, the variation in maximum total
heave predicted is about
±
Table 16.7 Values of Parameters Used in Parametric
Study
................
Lower
Median Upper
2%.
Figures 16.50 and 16.51 present the predicted vertical dis-
placements at the surface of the slab and under the center of
the slab, respectively, for various values of Young's mod-
ulus for concrete slab. The maximum total heave predicted
increases with a decreasing value of Young's modulus for
concrete. For a change in Young's modulus for the concrete
from 5 to 20 GPa, the variation in maximum total heave
predicted is about
±
Parameter
Values
Case
Values
Poisson's ratio,
μ
0.30, 0.35
0.40
0.45, 0.49
Swelling index,
C
s
0.085
0.090
0.095, 0.100
Initial void ratio,
e
0
0.920
0.962
1.000
Coefficient of earth
pressure at rest,
K
0
0.400
0.667
1.000
3%. However, the distribution of heave
at the surface of the slab changes considerably with the stiff-
ness of the slab. The concrete slab with the lowest Young's
±
Young's modulus of
concrete,
E
c
5 GPa
10 GPa
20 GPa


Search WWH ::

Custom Search