Environmental Engineering Reference
In-Depth Information
Vertical displacements (mm)
-25
0
25
50
75
100
125
150
0.0
0.5
1.0
Measured
Predicted
1.5
2.0
2.5
Figure 16.35
Measured and predicted vertical displacements with depth near center of concrete
slab.
Figure 16.35 compares the predicted vertical displace-
ments at various final suction conditions with the measured
total heave at the center of the slab. The agreement between
the predicted and the measured heave at different depths
differ to some degree. The amounts of heave measured at
depths of 0.58 and 0.85m correspond to the predicted heave
at 100 days, while the total heave of 106mm at ground sur-
face corresponds to the case when the pore-water pressure
goes to zero under the slab. An uplift of 106mm represents
the maximum heave observed on the slab. The maximum
heave observed at the cross section under consideration is
only 80mm (Fig. 16.22). The distribution of horizontal dis-
placements at different final suction conditions right under
the water line is presented in Fig. 16.36.
Figure 16.37 compares the predicted vertical displacement
at various final matric suction conditions with the measured
total heave at the top surface of the slab. The total heave
predicted under steady-state conditions agrees well with the
measured heave. There were some unknown loads near the
perimeter of the floor slab that could not be taken into
consideration in the study. The maximum predicted heave
was 107mm when assuming that the final pore-water pres-
sure increases from a negative value to zero. The maximum
heave of 130mm is predicted for the case when the final
pore-water pressures are assumed to be hydrostatic.
Figure 16.38 shows the measured and predicted water con-
tents under the center of the slab. The final water contents
predicted at steady-state conditions is about 3% less than the
measured final water contents. When the pore-water pres-
sure increases to zero, the predicted final water content is
about 2% more than the measured values. The distribution
of water contents in the soil predicted at steady-state condi-
tions is shown in Fig. 16.39. Figures 16.40 and 16.41 present
contours of horizontal and vertical displacements predicted
under steady-state conditions.
Several stress-deformation analyses were performed to
study the effect of each of the above parameters on the
solutions and to gain confidence in their significance to the
analysis. For each case, only the parameter under consider-
ation was allowed to vary while all other parameters were
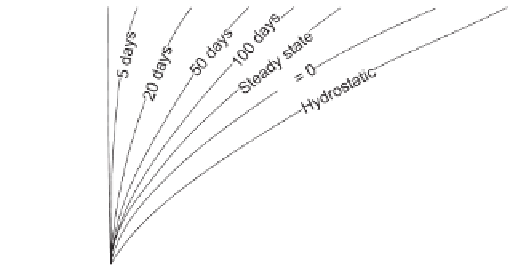
Horizontal displacements (mm)
−
6
−
4
−
2
0
2
4
6
0.0
50 days
Loading
0.5
1.0
1.5
2.0
2.5
Figure 16.36
Distribution of horizontal displacements with depth for different suction conditions
under water line.


Search WWH ::

Custom Search