Environmental Engineering Reference
In-Depth Information
Research Council of Canada, Saskatoon, Canada, on a slab-
on-grade in Regina, Saskatchewan. A two-dimensional heave
analysis was used to simulate the volume change problems
associated with the heave of a floor slab for a light indus-
trial building. The history of the site and details pertaining to
soil testing and performance monitoring were presented by
Yoshida et al. (1983).
Construction of the building and instrumentation took place
during the month of August 1961. Instrumentation installed
at the site included a deep benchmark, vertical movement
gauges, and a neutron moisture meter access tube. Vertical
ground movement was monitored at depths of 0.58 m, 0.85 m,
and 2.39m below original ground level. The building owner
noticed heave and cracking of the floor slab in early August
1962, about a year after construction. The owner also noticed
an unexpected increase in water consumption of approxi-
mately 35,000 L. The loss of water was traced to a leak in a
hot-water line beneath the floor slab, which was subsequently
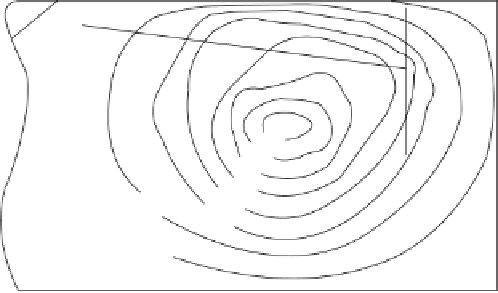
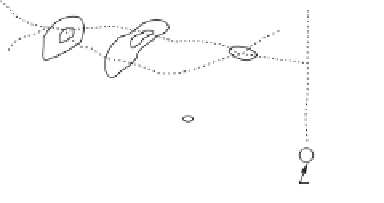
repaired. The location of the cracking and contours of heave
for the floor slab are shown in Fig. 16.22.
Laboratory analyses were performed on samples from a
borehole advanced on August 1961 for the installation of
the deep benchmark. Laboratory tests evaluated the Atter-
berg limits, in situ water content, grain-size distribution,
swelling indices, and corrected swelling pressures of the
soil. The liquid limit was found to be 77%, the plastic limit
was 33%, and the natural water content was 29%. The spe-
cific gravity
G
s
was 2.82 and the unit weight of the soil was
18.88 kN/m
3
.
Constant-volume oedometer tests on three samples were
used to evaluate initial void ratios, swelling indices, and cor-
rected swelling pressures. Table 16.5 presents the oedometer
test results and water contents of samples collected at differ-
ent depths. The average initial void ratio was 0.962 and the
average swelling index was 0.090. These values were used
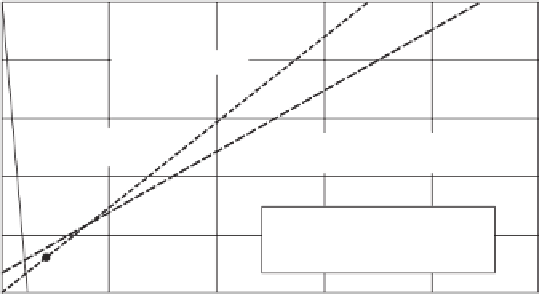
in the heave analyses. Figure 16.23 shows the distribution
of the corrected swelling pressure with depth. A straight
Approximate location
of hot-water line
Slab
cracking
Perimeter of
building
100
90
7
80
60
Hot-water
heater
50
Contours at 10-mm
intervals
40
30
0 1 2 3 4 5
20
Scale (m)
Figure 16.22
Floor plan of study site and contours of measured
heave (NMM
=
neutron moisture meter; GMG
=
ground move-
ment gauge; DBM
=
depth benchmark) (from Yoshida et al., 1983).
Table 16.5 Constant-Volume Oedometer Data
Corrected
Initital Void
Swelling
Swelling
Pressure,
P
s
(kPa)
Depth (m)
Ratio,
e
0
Index,
C
s
0.69
0.927
0.095
490
1.34
0.985
0.081
325
2.20
0.974
0.094
81
Source
: From Yoshida et al. (1983).
line can be used to represent the apparent distribution of the
corrected swelling pressure with depth. Figure 16.24 shows
the distribution of gravimetric water content with depth mea-
sured on August 21, 1961, using a neutron moisture meter
access tube.
Pressure or suction (kPa)
0
0
200
400
600
800
1000
Corrected
swelling pressure
0.5
1.0
In situ
overburden
Estimated
initial matric suction
1.5
P
′
s
= 271.5
y
+ 681.5
(
u
a
-
u
w
)
0
= 381
y
+ 888
2.0
2.5
Figure 16.23
Distribution of corrected swelling pressure and estimated initial matric suction
with depth.


Search WWH ::

Custom Search