Environmental Engineering Reference
In-Depth Information
1.1
1.0
0.9
0.8
0.7
0.6
0.5
0.4
0.3
0.2
0.1
0
2.0
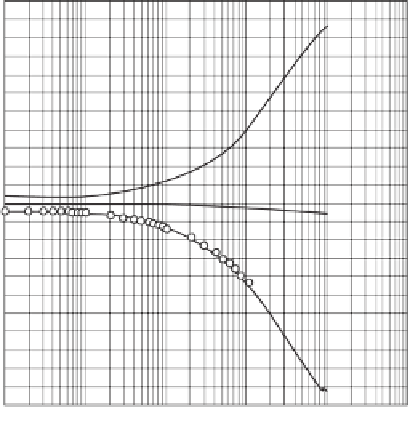
Coefficient of permeability of :
Water: 2.3 x 10 m/s
Air: 8.0 x 10
1.8
−
11
Coefficient of permeability of :
Water: 1.0 x 10
1.6
−
10
−
12
m/s
m/s
1.4
−
12
Air: 2.0 x 10
m/s
Air phase
1.2
Water phase
1.0
0.8
+
0.6
0.4
+
Soil structure
0.2
0.1
0
0.2
Soil structure
-
0.3
0.2
-
0.4
0.4
Air phase
0.5
0.6
0.6
Water phase
0.1
1.0
10
100
1000
10,000
0.7
Elapsed time (min)
0.8
0.9
Figure 16.12
Theoretical simulation of laboratory test involving
increase in water pressure (test 4).
1.0
1.1
10
100
1000
10,000
100,000
1
Elapsed time (min)
6
5
4
3
2
1
0
1
2
3
4
5
6
7
Figure 16.10
Theoretical simulation of laboratory test involving
increase in air pressure (test 2).
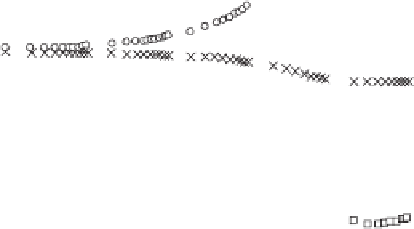
Coefficient of permeability of :
Water : 3.3 x 10
−
11
m/s
Air : 8.0 x 10
−
12
m/s
Water phase
6
5
4
3
2
1
0
1
2
3
4
5
6
7
8
9
+
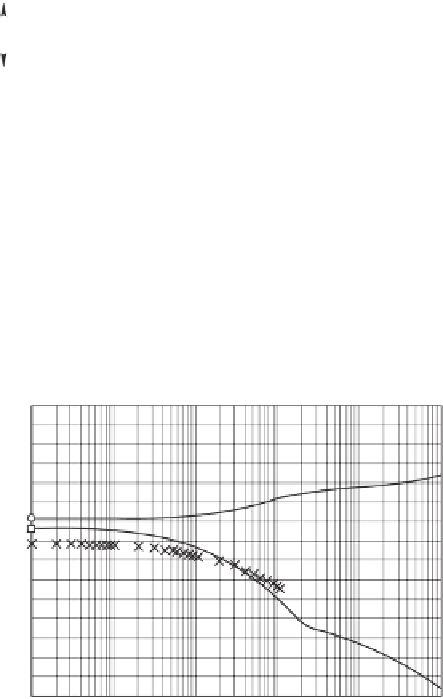
Coefficient of permeability of :
Water: 0.5 x 10
−
13
m/s
−
11
Air: 4.0 x 10
m/s
+
-
Soil structure
Water phase
Air phase
-
Soil structure
Air phase
0.1
1.0
10
100
1000
10,000
Elapsed time (min)
Figure 16.13
Theoretical simulation of laboratory test involving
increase in water pressure (test 5).
0.1
1.0
10
100
1000
10,000
Elapsed time (min)
Figure 16.11
Theoretical simulation of laboratory test involving
decrease in air pressure (test 3).
pressures were established, the air and water phases were
subsequently allowed to drain during a consolidation test.
The pore-air and pore-water pressures were observed to
reduce to their values prior to undrained loading. In other
words, the net normal stress increased with elapsed time and
matric suction returned to its original value at the end of the
consolidation process.
Figure 16.16 presents the results of pore pressure and vol-
ume change measurements during the consolidation test. The
initial volume-mass properties of the soil specimen and its
stress state variables are shown in Table 16.4.
The results shown in Fig. 16.16a indicate that the excess
pore-air pressures dissipated almost immediately throughout
the soil specimen. The rapid dissipation of air pressures
was observed in every consolidation test performed on the
silty sand (Rahardjo, 1990). On the other hand, the excess
pore-water pressure dissipation occurred in a time-dependent
The
K
0
cylinder allowed for the simultaneous measurement of
pore-air and pore-water pressures at various depths along the
soil specimen. The top and bottom of the soil specimen were
connected to a low- and a high-air-entry disk, respectively.
Air flowed upward and water flowed downward during the
consolidation test. The total and water volume changes were
independently monitored.
16.4.5 Presentation of Consolidation Results
on Silty Sand
Slurry specimens of silty sand were subjected to a gradual
increase in net normal stress and matric suction. The speci-
mens were then subjected to an increase in total stress under
undrained conditions. After excess pore-air and pore-water


Search WWH ::

Custom Search