Environmental Engineering Reference
In-Depth Information
The pore pressure response curve exhibits a nonlinear rela-
tionship between pore-water pressure and total pressure at
low overburden pressures (i.e., total stresses) or at degrees
of saturation less than 100%. The relationship between pore
pressure and total stress becomes linear with a slope of 45
◦
as saturation conditions are approached. A change in total
stress under undrained conditions produces an equal change
in pore-water pressure at saturation conditions. The pore-
water pressure versus total stress plot will have different
shapes depending upon the initial degree of saturation and
the compressibility of the soil.
The compressibility of the soil is handled in a slightly
different manner between the analytical method and the
graphical method. An average constant coefficient of vol-
ume change is assumed for the entire total stress change
in the analytical method. A constant coefficient of volume
change is not required in the graphical method. The use
of the nonlinear consolidation curve for obtaining the pore-
water pressure versus total stress relationship implies that
varying coefficient-of-volume-change values have been used
in the graphical analysis.
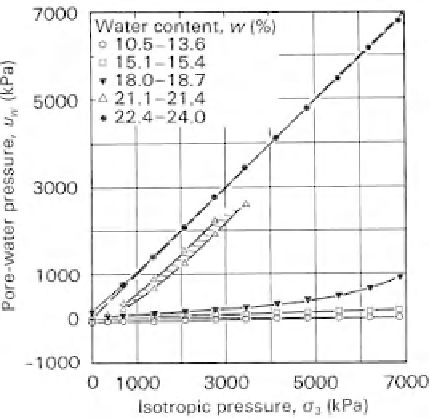
specimen under isotropic loading. The specimens were
statically compacted and subjected to isotropic pressures up
to 6900 kPa. Two types of soil were investigated: Peorian
loess (i.e., an inorganic silt) and Champaign till (i.e., a
well-graded glacial till).
The development of pore-water pressure during the appli-
cation of an isotropic pressure is shown in Figs. 15.21 and
Fig. 15.22 for Peorian loess and Champaign till, respec-
tively. The plots indicate a low pore-pressure response (i.e.,
a flat curve) for the conditions of low initial water con-
tent or low initial degree of saturation. The pore pressure
response increases as the initial water content (and degree of
saturation) increases. As a result, the
B
w
parameter also
increases with an increase in the initial degree of saturation.
15.6.3 Experimental Results of
B
Tangent Pore
Pressure Parameters (Isotropic Loading)
The
B
tangent pore pressure parameters for isotropic loading
are quite readily measured in the laboratory. A soil specimen
is subjected to an equal all-around or isotropic pressure
σ
3
.
The pore-air and pore-water pressures are measured as the
isotropic pressure is increased. The pore pressure response
du
due to a finite increment in total stress
dσ
3
is expressed
as a tangent parameter
B
.The
B
pore pressure parameters
vary as the isotropic pressure increases. Figure 15.20 shows
the relationship between the
B
w
pore pressure parameter
and the degree of saturation for clayey gravel. A substantial
decrease in
B
w
is observed near optimum water content.
An apparatus and test procedure were developed by
Campbell (1973) to measure the independent generation
of pore-air and pore-water pressures in an unsaturated soil
Figure 15.21
Pore-water pressure development in Peorian loess
under isotropic, undrained loading (after Campbell, 1973).
Figure 15.20
Relationship between
B
w
pore-water pressure
parameter and degree of saturation for clayey gravel (after Skemp-
ton, 1954).
Figure 15.22
Pore-water pressure development in Champaign till
under isotropic, undrained loading (after Campbell, 1973).


Search WWH ::

Custom Search