Environmental Engineering Reference
In-Depth Information
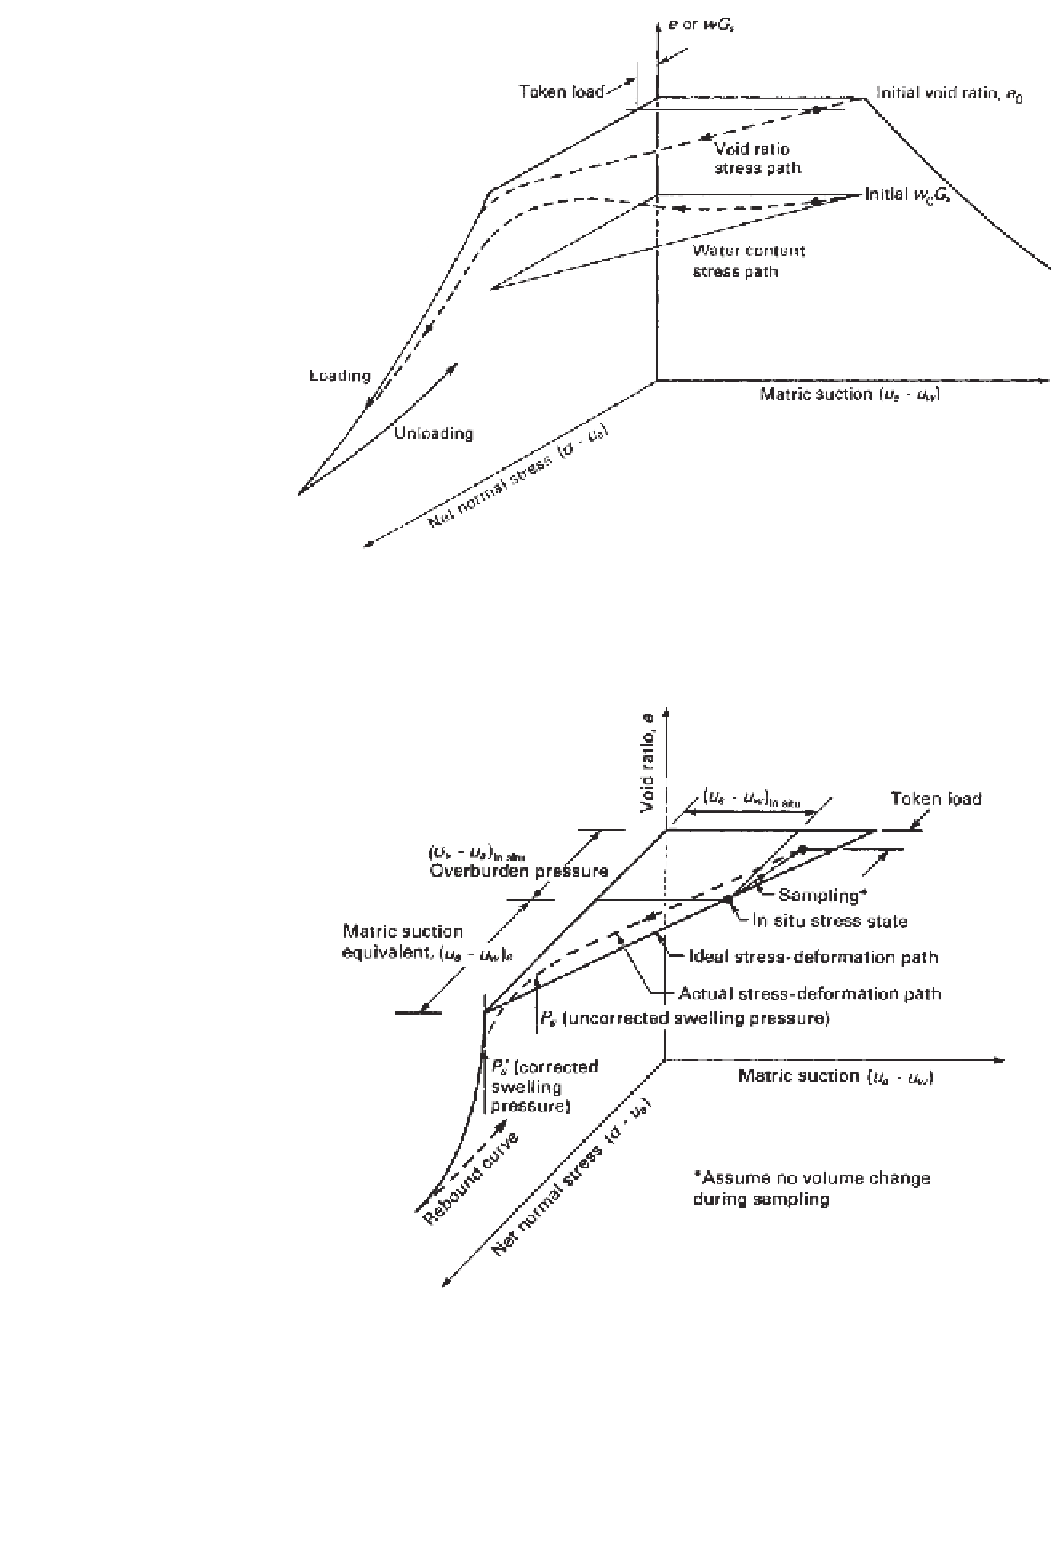
Figure 14.13
“Ideal” stress path adhered to during constant-volume oedometer test.
Figure 14.14
Ideal and actual stress paths showing effect of sampling disturbance.


Search WWH ::

Custom Search