Environmental Engineering Reference
In-Depth Information
for the effects of sampling disturbance. In other words, the
natural water content compression curve provides a measure
of the effect of sampling disturbance. The stress paths of more
recent, updated versions of the double-oedometer method can
also be visualized on similar three-dimensional plots in terms
of net normal stress and matric suction.
Fredlund et al., (1980a) proposed the use of constant-
volume oedometer test results in predicting total heave. It
was suggested that the measured swelling pressure be cor-
rected for sampling disturbance. A graphical technique for
correcting the measured swelling pressure was proposed.
The correction procedure was similar to the Casagrande con-
struction used for determining the preconsolidation pressure
of a saturated soil. Details of the correction procedure are
explained later.
Each of the proposed heave prediction procedures can
be plotted on a three-dimensional plot with the stress state
variables used for the horizontal axes. The heave procedure
described later in this chapter is consistent with the volume-
mass constitutive relations for unsaturated soils (Fredlund
et al., 1980a).
e
0
Overburden
Constant volume
Applied load,
σ
(a)
Token load
Undisturbed
Sampling
Reload
(lab)
Disturbed
In situ stress
state
Matric suction
(
u
a
-
u
w
)
14.3.3 Some Factors Affecting Total Heave
Several properties of unsaturated soils have been found to
influence the amount of volume change that can occur when
the soil is allowed to fully imbibe water. Holtz and Gibbs
(1956) summarized the effect of initial water content and dry
density on the total heave of compacted expansive Porter-
ville clay (Fig. 14.6). The heave was measured by placing
the soil in an oedometer ring and submerging it in water.
The specimens were subjected to a surcharge load of 7 kPa.
Figure 14.6 shows that total heave increases with decreas-
ing initial water content or increasing initial dry density. The
results show that when the clay is compacted at optimum
water content under standard AASHTO compaction it will
(b)
Figure 14.4
Stress path followed when using Sullivan and
McClelland method: (a) two-dimensional plot depicting stress path;
(b) three-dimensional plot showing stress path.
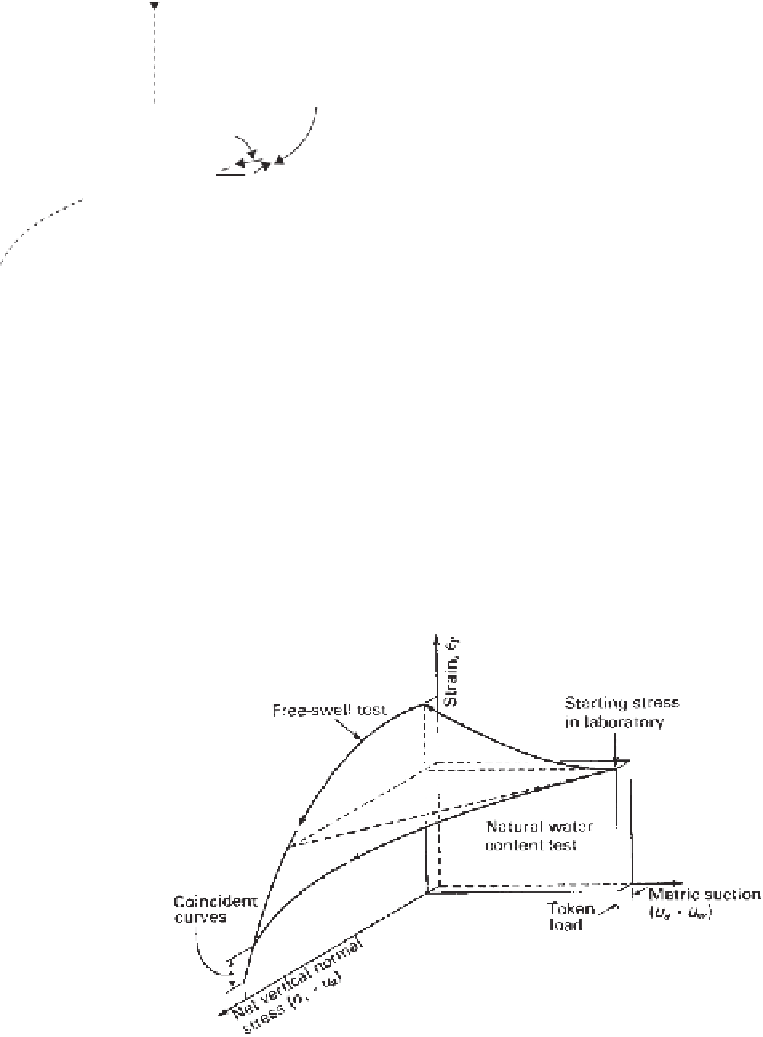
vertically to match the free-swell test results at high applied
loads. Various loading conditions and final pore-water pres-
sures can be simulated in the analysis. The stress paths
followed by the two tests are shown in Fig. 14.5.
Predicted values of heave have generally been satisfactory.
The method of analyzing the data appears to compensate
Figure 14.5
Stress paths followed when using double-oedometer method (after Jennings and
Knight, 1957).


Search WWH ::

Custom Search