Environmental Engineering Reference
In-Depth Information
50
10
11
15
1
26
Number of blows in
liquid limit test
25
54
40
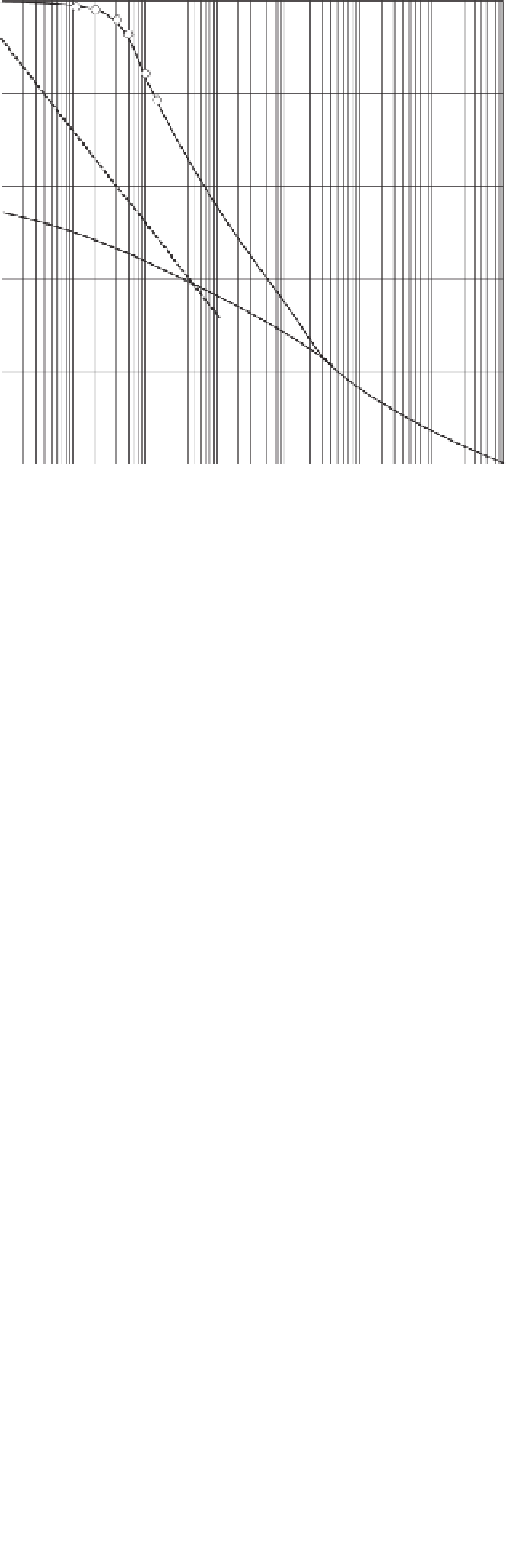
Initially slurried soil
Drying curve
60
175
75
30
B
C
A
Continuously disturbed soil
20
Plastic limit
Drying curve
10
Natural soil
0
0.1
1
10
100
1,000
10,000
100,000
100,000 1,000,000
Matric suction (
u
a
−
u
w
), kPa
Figure 13.68
SWCCs for silty clay (after Croney and Coleman, 1954).
extending the above information to formulate continuous
mathematical functions for combinations of isotropic net
total stress and soil suction changes.
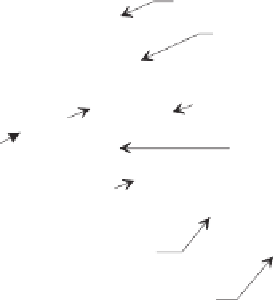
0.9
Slope =
de
dw
=
a
m
b
m
0.8
Natural soil
0.7
13.8.3 Odometer Equipment Modifications
for Measuring Stress-Deformation Properties
Test procedures for oedometer tests on unsaturated soil spec-
imens (e.g., compacted specimens) are described in ASTM
D4546. The ASTM standard describes three methods for
inundating soil specimens prior to performing the oedome-
ter test. The matric suction of the soil is brought to zero
through inundation and the results can routinely be used to
calculate the swelling potential of a soil. Inundation can be
conducted under constant-volume or free-swell conditions.
Further details regarding the laboratory test procedure are
given in Chapter 14.
Curve 1 in Figs. 13.70 and 13.71 illustrate oedometer test
results that utilize the constant-volume inundation procedure
at the beginning of the test. The soil specimen is allowed to
attain an equilibrium state following immersion with water
under initial total stress conditions. The test then proceeds
using a conventional oedometer test procedure for testing sat-
urated soils (ASTM D2435). Decreasing void ratios during
loading are plotted against the logarithm of effective stress
σ
−
u
w
to yield curves 1 and 3, as shown in Figs. 13.70
and 13.71.
0.6
0.5
0.4
Assumed
G
s
= 2.7
0.3
0.2
Saturation line
0.1
0.0
0
4
8
12
16
20
24
28
32
Water content (
w
), %
Figure 13.69
Shrinkage curve relationship for silty clay (from
Croney and Coleman, 1954).
void ratio and the water content curves are the same when
the soil is saturated, varying only with respect to net normal
stress or effective stress
σ
−
u
w
(i.e., curve 1 in Fig. 13.71).
The compression (i.e., void ratio) and water content
curves apply to the “limiting” boundaries of the volume-
mass constitutive surfaces. However, these relationships
do not describe how the constitutive surfaces vary for
intermediate stress state changes. The Pham and Fredlund
(2011a) volume-mass constitutive model is of assistance in
13.8.4 Pressure Plate Drying Tests
The SWCC (i.e., curve 4 in Figs. 13.70 and 13.71)
relates water content to applied soil suctions. The initial
pore-air pressure
u
a
is usually assumed to be atmospheric


Search WWH ::

Custom Search