Environmental Engineering Reference
In-Depth Information
100
90
80
70
60
50
40
30
20
Measured data (initially drying)
Measured data (boundary wetting)
Predicted curves
10
0
10
6
0.1
1
10
100
1000
10,000
100,000
Soil suction, kPa
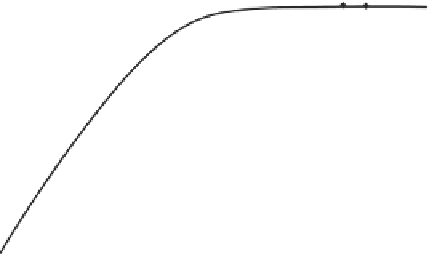
Figure 13.62
Measured and predicted degree-of-saturation for kaolin (data from Fleureau et al.,
1995).
σ
y
+
∂σ
y
∂
2.5
y
dy
τ
yz
+
∂τ
yz
∂
yx
+
∂τ
yx
∂
∂
y
dy
y
dy
2.0
y
∂
xz
+
∂τ
xz
∂
x
dx
1.5
τ
xy
z
σ
x
+
∂σ
x
∂
τ
xz
F
x
F
z
1.0
x
dx
σ
x
τ
τ
zy
F
y
dy
τ
xy
+
∂τ
x
y
∂
0.5
τ
zx
x
dx
σ
z
Measured data points
Predicted curve
τ
yz
0
dz
0
10
20
30
40
50
60
70
80
90
τ
yx
x
Gravimetric water content, %
0
σ
y
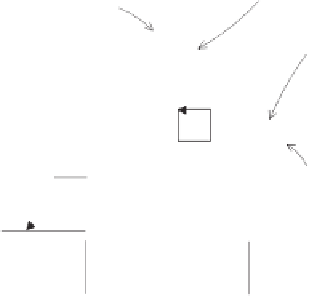
Figure 13.63
Measured and predicted shrinkage curve for kaolin
(data from Fleureau et al., 1995).
dx
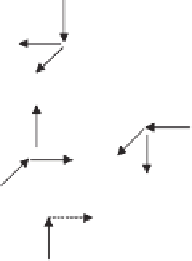
Figure 13.65
Representative elemental volume of soil showing
the surface tractions on all faces.
100
where:
80
F
x
,F
y
,F
z
=
body force acting in the
x-, y-,
and
z-
directions per unit volume, kN/m
3
.
60
40
The pore-water and pore-air pressures have no direct role
in the equilibrium of forces acting upon the faces of a rep-
resentative elemental volume of soil.
20
Measured data points
Predicted curve
0
0 0 0 0 0 0 0 0 0
Gravimetric water content, %
13.7.2 Strain-Displacement Relationships
and Compatibility Equations
The classical definition of strain can be applied to an unsatu-
rated soil element. The normal strain in a given direction,
,
Figure 13.64
Measured and predicted curve plotting gravimetric
water content versus degree of saturation for kaolin (data from
Fleureau et al., 1995).


Search WWH ::

Custom Search