Environmental Engineering Reference
In-Depth Information
the conservation of linear and angular momentum (i.e.,
equilibrium of forces) for a REV. A variety of consti-
tutive stress-strain models can be substituted into the
conservative equations of equilibrium with the result of
obtaining partial differential equations that can be solved
for saturated-unsaturated soil continua. In each case, it is
necessary to convert saturated-unsaturated soil properties
and unsaturated soil property functions into elastic and
plastic parameters that are consistent with the model used in
the formulations. The stress-deformation formulations must
be solved using a computer.
2.5
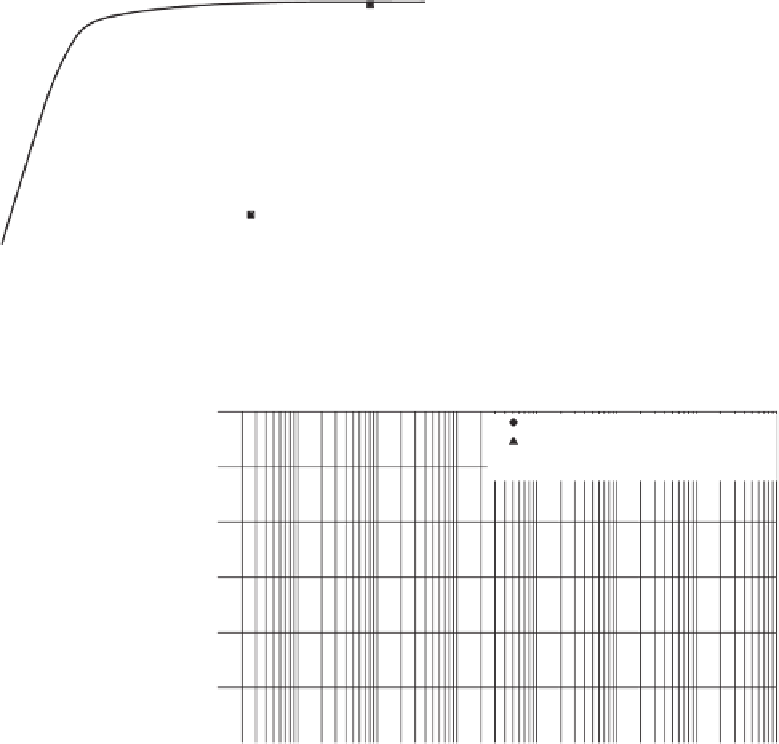
Measured data points
Predicted curve
2.0
1.5
1.0
0.5
13.7.1 Conservation of Linear and Angular
Momentum
The distribution of total stresses within an unsaturated soil
is governed by the static equilibrium of forces. Stresses act-
ing on each face of an element can be decomposed as the
normal and shear components in the
x-
,
y-
, and
z
-directions,
as shown in Fig. 13.65. All stresses shown in Fig. 13.65
are positive, in accordance with geotechnical engineering
convention.
The balance of angular momentum with respect to any
axis shows that the Cauchy tensor must be symmetric (i.e.,
t
ij
=
t
ji
). The balance of linear momentum (i.e., the equi-
librium of forces) results in the partial differential equations
governing static equilibrium of forces (Chou and Pagano,
1967a). Overall stress equilibrium equations can be written
for the
x-, y-,
and
z-
coordinate directions:
0
0
0.5
1.0
1.5
2.0
2.5
Gravimetric water content x
G
s
Figure 13.56
Measured and predicted shrinkage curve for Regina
clay (data from Fredlund, 1964).
100
80
60
40
∂τ
yx
∂y
+
∂σ
x
∂x
+
∂τ
zx
∂z
+
F
x
=
20
0
(13.132)
Measured data points
Predicted curve
0
∂τ
xy
∂x
+
∂σ
y
∂y
+
∂τ
zy
∂z
+
F
y
=
0
20
40
60
80
100
0
(13.133)
Gravimetric water content, %
Figure 13.57
Measured and predicted curve plotting degree of
saturation versus gravimetric water content for Regina clay (data
from Fredlund, 1964).
∂τ
yz
∂y
+
∂τ
xz
∂x
+
∂σ
z
∂z
+
F
z
=
0
(13.134)
60
Measured data (initially drying)
Measured data (boundary wetting)
Best-fitted initially drying
Predicted boundary wetting
50
40
30
20
10
0
0.1
1
10
100
1000
10,000
100,000
10
6
Soil suction, kPa
Figure 13.58
Measured and best-fit initial drying and wetting SWCCs for Jossigny silt (data
from Fleureau et al., 1995).


Search WWH ::

Custom Search