Environmental Engineering Reference
In-Depth Information
Table 12.9 Strength Properties for Soils of Example 1
Unit Weight
(kN/m
3
)
c
φ
Soil Type
(kPa)
(deg)
Colluvium
19.6
10.0
35.0
Completely weathered
granite
19.6
15.1
35.2
Completely to highly
weathered granite
19.6
23.5
41.5
weathered granite. The bedrock was situated 20-30m below
ground surface. The water table was located well into the
bedrock. Potential failures through the steep slope would
likely be associated with relatively shallow slip surfaces.
Triaxial tests on undisturbed core samples were conducted
and the results are presented in Table 12.9. The average
measured
φ
b
angle for the soil was 15
◦
(Ho and Fredlund,
1982a).
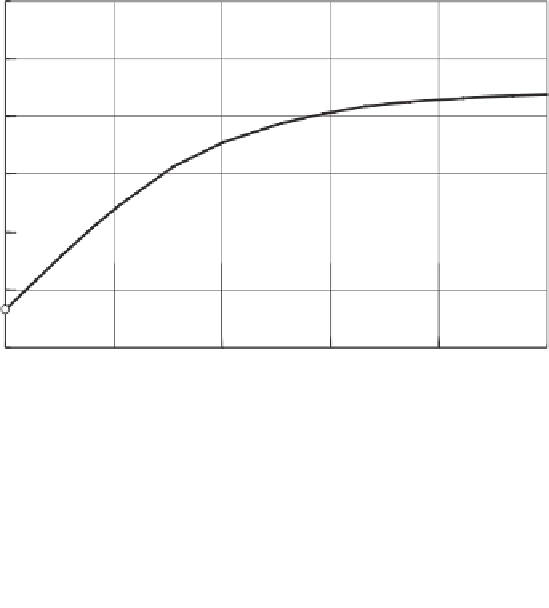
In situ measurements of matric suction were conducted
from the face of the slope using tensiometers. Two typical
matric suction profiles measured near section
A
-
A
are shown
in Fig. 12.92. The suction profiles showed considerable vari-
ation indicative of changing microclimatic conditions near
the proximity of the slope face. No matric suction measure-
ments were made near the upper part of the slope.
Slope stability analyses were performed on cross section
A
-
A
shown in Fig. 12.93. The Bishop simplified method of
slices was used for all analyses. The analyses used circular
slip surfaces passing through the toe of the slope.
Figure 12.92
In situ measurements of matric suction near section
A
-
A
for example 1 (from Sweeney, 1982).
c
)for
the first analysis. The lowest factor of safety for the section
A-A
cross sections was 0.864, indicating unstable slope con-
ditions. However, the slope appeared to be stable. It was
assumed that the shear strength contribution due to matric
suction was playing a significant role in the overall stability
of the slope.
Matric suction was taken into account for subsequent anal-
yses with cohesion increased in accordance with the maric
suction. Each cross section was divided into substrata that
were parallel to the water table. Each substratum was 5m
thick and was assumed to have an independent total cohesion
The effect of matric suction was ignored (i.e.,
c
=
1.4
1.3
1.2
Section:
A-A
1.1
F
s
= 1.0
1.0
0.9
0.8
0
20
40
60
80
100
Matric suction profile, %
Figure 12.93
Calculated factors of safety considering various matric suction conditions for
section
A
-
A
in example 1.


Search WWH ::

Custom Search