Environmental Engineering Reference
In-Depth Information
Table 11.7 Direct Shear Tests on Unsaturated
Compacted Soils
.....................................
Red Clay of
Guadalix de
Madrid
Properties
la Sierra
Clayey Sand
Liquid limit
33
32
Plasticity index
13.6
15
Sieve analysis: % passing
10
—
100
16
100
94
40
97
48
200
86.5
17
AASHTO standard
compaction
ρ
d
maximum
(
kg/m
3
)
1800
1910
w
optimum (%)
17
11.5
Initial conditions
ρ
d
0
(
kg/m
3
)
1800
1910
w
0
(%)
13.6
9.2
u
a
−
u
w
0
(kPa)
2.8
0.7
Consolidation time under
applied total stress and
matric suction (days)
4
4
10
−
5
10
−
5
Displacement rate,
d
h
(mm/s)
2.8
×
2
.
8
×
Time to failure,
t
f
(days)
2-3
1-2
Source:
From Escario and Saez (1986).
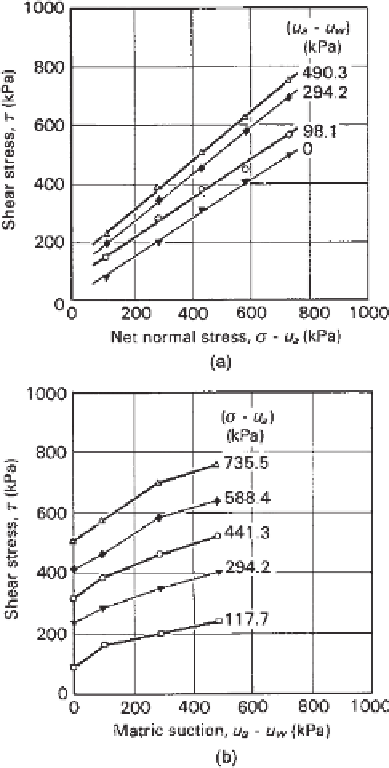
Figure 11.81
Direct shear tests on compacted red clay of
Guadalix de la Sierra: (a) horizontal projection of failure envelope
onto
τ
versus
σ
appropriate strain rate. Gibson and Henkel (1954) and
Bishop and Henkel (1962) presented test data showing the
variation in strength (i.e., the deviator stress at failure) with
strain rate. The shear strength tended to a constant value
below a particular strain rate, indicating a suitable strain
rate for failing the soil specimen. No measurements were
made to ensure that this strain rate limit was slow enough
for complete pore pressure equalization or dissipation.
Satija and Gulhati (1979) concluded from measured test
results that deviator stress is not highly sensitive to the effect
of varying strain rates (Figs. 11.83a and 11.84a). It was
suggested that changes in matric suction be used for CW
tests (Fig. 11.83b), and changes in water content be used
for CD tests (Fig. 11.84b), as a reasonable indicator of an
appropriate strain rate. Tests were performed on specimens
of compacted Dhanauri clay using strain rates varying from
5
.
3
u
a
plane; (b) horizontal projection of failure
envelope onto
τ
versus
u
a
−
−
u
w
plane (after Escario and Saez,
1986).
(1960). Two compacted clay shale specimens 101.6mm in
diameter and 203.2mm in height were tested at two differ-
ent strain rates (i.e., 6
.
9
10
−
5
%
/s
). The
pore-water pressure was measured at the base of the speci-
men and at the midheight of the specimen. The results are
presented in Figs. 11.85 and 11.86 for strain rates of 6
.
9
10
−
4
and 4
.
6
×
×
×
10
−
4
and 4
.
6
10
−
5
%
/s
respectively. The higher strain rate
resulted in significantly different pore-water pressures across
the specimen (Fig. 11.85b). The base measurement of pore-
water pressure was higher than the midheight measurement.
As a result, the principal stress ratios computed from the
two pore-water pressure measurements were also different
(Fig. 11.85a). This difference affects the assessment of the
shear strength properties. Closer agreement between the pore-
water measurements at the base and at the midheight point
was obtained when using a slower strain rate (Fig. 11.86b).
×
10
−
5
10
−
3
×
to 3
.
3
×
(%
/
s). It was concluded that a
10
−
4
(%
/
s) was adequate for CW tests
on Dhanauri clay. The strain rate for CD tests was chosen
to be one-fifth of the strain rate for CW tests (i.e., 1
.
3
strain rate of 6
.
7
×
×
10
−
4
%
/s
).
The effect of strain rate on the equalization of pore-water
pressures for undrained tests was studied by Bishop et al.


Search WWH ::

Custom Search