Environmental Engineering Reference
In-Depth Information
w
d
w
w
f
(a)
w
d
w
w
f
(b)
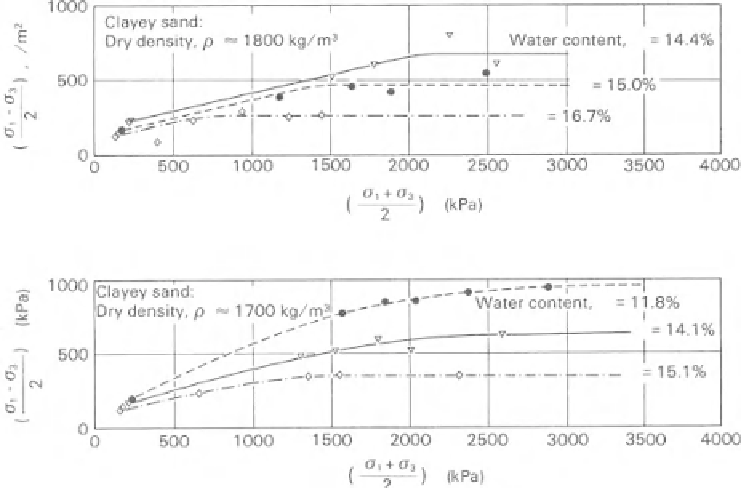
Figure 11.76
Total stress point envelopes obtained from undrained triaxial and unconfined
compression tests on clayey sand: (a) total stress point envelopes for high-density specimens;
(b) total stress point envelopes for low-density specimens (after Chantawarangul, 1983).
Table 11.6 Volume-Mass Properties for Five Speciemens Tested Using Multistage Direct Shear Tests (from Gan
et al., 1987)
Specimen No.
GT-16-N1
GT-16-N2
GT-16-N3
GT-16-N4
GT-16-N5
Intitial Properties:
Void ratio,
e
0
0.77
0.53
0.69
0.51
0.54
Degree of saturation,
S
0
(%)
42
59
48
65
61
Water content,
w
0
(%)
11.8
11.5
12.3
12.2
12.1
the matric suction
u
a
−
u
w
between stages. The matric suc-
tion ranged from 0 to 500 kPa. Failure envelopes of shear
strength versus matric suction were plotted based on near-
failure conditions at the end of each stage of testing. The
results showed that the shear strength versus matric suction
was nonlinear when the soil was tested over a wide matric
suction range.
Matric suction equalization was generally attained in about
1 day for these particular tests. Typical results from the mul-
tistage direct shear tests on unsaturated specimens are illus-
trated in Figs. 11.77 and 11.78 for two test specimens. The
vertical deflection versus horizontal displacement curves gen-
erally showed that the soil dilated during shear, except during
the initial stages at low matric suctions. The curves showed
an increase in the specimen height with increasing horizontal
displacement as matric suction increased.
A plot of shear stress versus matric suction for sample GT-
16-N5 is shown in Fig. 11.79. The plotted shear strength
values correspond to a shear displacement of 1.2 mm. The
line joining the data points forms the shear stress versus
matric suction failure envelope. The envelope corresponds to
an average net normal stress of 72 kPa at failure (Fig. 11.79a).


Search WWH ::

Custom Search