Environmental Engineering Reference
In-Depth Information
(a)
Figure 11.66
Intersection line between failure envelope and the
τ
versus
u
a
−
u
w
plane for compacted shale (data from Bishop
et al., 1960).
et al. (1960). The shale had a clay fraction of 22% and
was compacted at a water content of 18.6%. A series of
triaxial tests on saturation specimens of compacted shale
gave an effective angle of internal friction
φ
of 24.8
◦
and
an effective cohesion
c
of 15.8 kPa. The laboratory results
were reanalyzed by Fredlund et al. (1978), and the results
are presented in Fig. 11.66. The
φ
b
angle was 18.5
◦
for the
compacted shale when assuming a constant effective angle
of internal friction during the interpretation of the data.
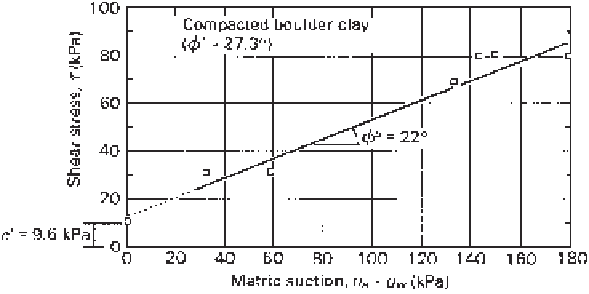
The boulder clay had a clay fraction of 18% and was
compacted at a water content of 11.6%. The saturated boul-
der clay showed an effective angle of internal friction
φ
of 27.3
◦
and an effective cohesion
c
of 7.6 kPa. The tests
on the compacted boulder clay were performed at a strain
rate of 3.5
(b)
(c)
10
-5
%/
s, and 15% strain was considered
to represent failure conditions. The laboratory results were
reanalyzed by Fredlund et al. (1978) and the results are pre-
sented in Figs. 11.67. The average
φ
b
angle was 22.0
◦
for
the boulder clay when assuming a constant effective angle
of internal friction during the interpretation of the data.
×
Figure 11.65
Stress versus strain curves and presentations of
failure envelope for Tappen-Notch Hill Silt specimen No. E-3:
(a) deviator stress versus strain curve; (b) failure envelope pro-
jected onto
τ
versus
σ
-u
a
plane; (c) line defining slope of shear
strength with respect to matric suction (from Krahn et al., 1989).
Figure 11.67
Intersection line between failure envelope and
τ
versus
u
a
−
u
w
plane for com-
pacted boulder clay (data from Bishop et al., 1960).


Search WWH ::

Custom Search