Environmental Engineering Reference
In-Depth Information
representation of a problem. The shear strength is therefore
related to total stresses without an understanding of the
pore pressures at failure.
The net confining pressure
σ
3
−
with a
B
pore pressure parameter which must be less
than 1.0. Higher confining pressures result in higher net
confining pressures (i.e.,
σ
3
−
u
a
at
A
<σ
3
−
u
a
at
A
1
<
σ
3
−
u
a
at
A
2
<σ
3
−
u
a
at
A
3
) and lower matric suctions
u
a
and matric suction
(i.e.,
u
a
−
u
w
at
A
>u
a
−
u
w
at
A
1
>u
a
−
u
w
at
A
2
>
u
a
−
u
w
vary throughout the shear process. However, the
stress state variables during shear and at failure are unknown
when the pore fluid pressures are not measured. Figure 11.53
illustrates how the stress state variables might change dur-
ing an undrained triaxial test (i.e., assuming the pore fluid
pressure had been measured). Only the total confining pres-
sure
σ
3
and the deviator stress
σ
1
−
u
a
−
u
w
at
A
3
). In other words, the four identical soil
specimens are brought to four different initial stress states
which are represented by stress points
A, A
1
,A
2
,
and
A
3
(Fig. 11.54). As the soil is sheared under undrained
conditions, the pore fluids are further compressed and the
pore pressures may further increase. The stress
poi
nt moves
from point
A
to point
B
along the stress path
AB
. The net
confining pressure and matric suction of the soil specimen
decrease when going from stress point
A
to stress point
B
. Stress point
B
represents the stress state of the soil at
failure. Similar stress paths are followed by t
he s
oil
spec
i-
men
s at
stress points
A
1
,A
2
, and
A
3
(i.e.,
A
1
B
1
,
A
2
B
2
,
and
A
3
B
3
).
Figure 11.54 shows an increase in the diameter of the
Mohr circle at failure as the initial total confining pressure
σ
3
are values gener-
ally measured during an undrained test. Typical stress-strain
curves for the undrained test are shown in Fig. 11.6a. These
are the results of a special test in the sense that the pore-
air and pore-water pressures were measured during shear
(Fig. 11.6b). The pore-water pressure measurements were
limited to -101.3 kPa (Bishop et al., 1960). The plot of
overall volume change in Fig. 11.6c indicates that the soil
specimen compressed during shear.
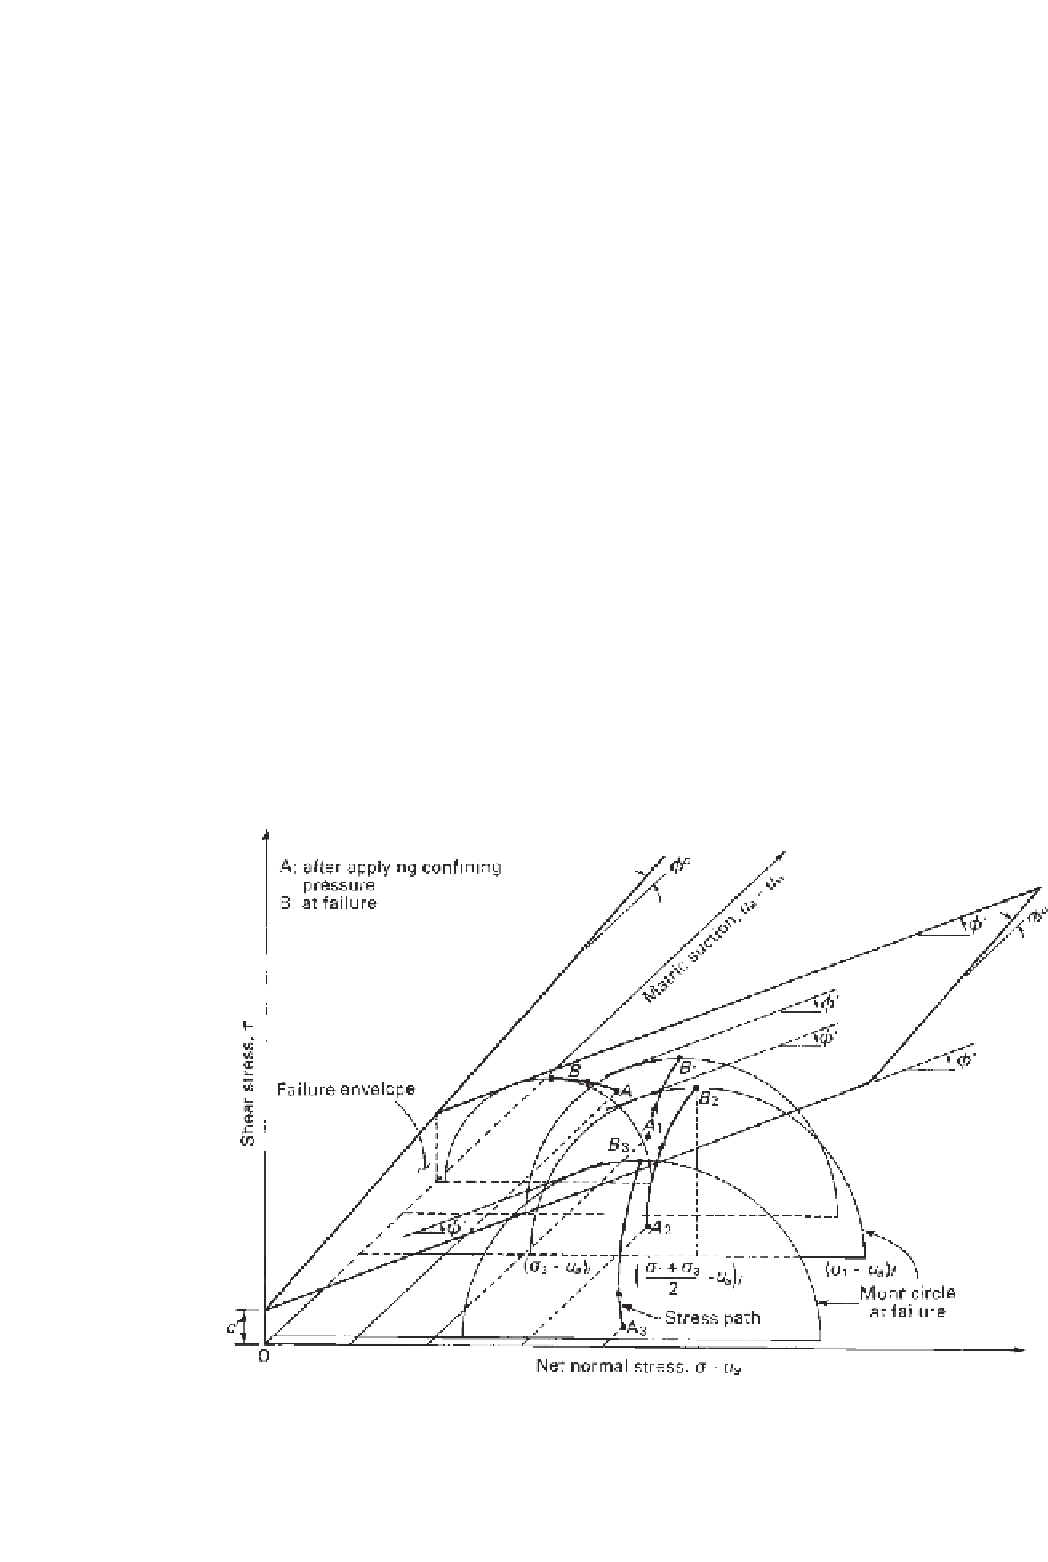
Hypothetical stress paths that could represent changes
during the undrained test are illustrated in Fig. 11.54. Con-
sider four identical specimens that are initially confined at
four different confining pressures. The hypothetical results
are represented by stress points
A
,
A
1
,A
2
, and
A
3
, where
σ
3
at
A
<σ
3
at
A
1
<σ
3
at
A
2
<σ
3
at
A
3
. The application
of the total confining pressure under undrained conditions
results in the compression of the pore fluids and the
development of excess pore-air and pore-water pressures.
The pore pressure increases in an unsaturated soil are less
than the total stress increment applied. This is in keeping
increases [i.e.,
σ
1
−
σ
3
f
at
B
<
σ
1
−
σ
3
f
at
B
1
<
σ
1
−
σ
3
f
at
B
3
]. In other words,
the shear strength of the soil increases with increasing
initial total confining pressure even though the initial
matric suction decreases. This occurs because the rate of
shear strength increase caused by an increase in confining
pressure is greater than the reduction in shear strength
caused by a decrease in matric suction. This phenomenon
can also be visualized as occurring because the
φ
b
angle is
lower than the effective angle of internal friction,
φ
.
σ
3
f
at
B
2
<
σ
1
−
Figure 11.54
Stress paths followed during undrained triaxial test.


Search WWH ::

Custom Search