Environmental Engineering Reference
In-Depth Information
556
11
SHEAR STRENGTH OF UNSATURATED SOILS
the net major principal stress reaches a value of
σ
1
−
u
a
f
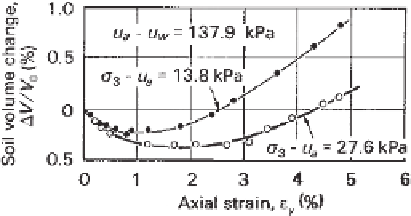
The water volume change (i.e.,
V
w
/V
0
) and overall spec-
imen volume change (i.e.,
V
/
V
0
) during compression are
presented in Figs. 11.44b and 11.44c, respectively, for the
specimens sheared under two different net normal stresses.
Typical stress paths followed during consolidated drained
tests subjected to constant matric suction are illustrated in
Fig. 11.45. The tests are performed on several specimens at
various net confining pressures. For example, stress point
A
represents the stress state at the end of consolidation when
the soil specimen had a net confining pressure
σ
3
−
at failure.
Blight (1967) reported the results of several consolidated
drained tests performed on unsaturated silt specimens. All
specimens were compacted at a water content of 16.5%
using the standard AASHTO compaction effort. The speci-
mens were then brought to equilibrium at three matric suc-
tion values in a triaxial cell. Two specimens with constant
matric suction values were tested at two different net confin-
ing pressures
σ
3
−
u
a
, and
u
a
(i.e., 13.8 and 27.6 kPa). The deviator
stress versus strain curves are shown in Fig. 11.44a. The
results indicate an increase in shear strength with increas-
ing matric suction and increasing net confining pressure.
amatricsuction
u
a
−
u
w
. As the soil is compressed dur-
ing shear, the stress po
int
moves from point
A
to point
B
along the stress path
AB
. Stress point
B
represents the
stress state at the condition of failure. When moving from
stress point
A
to stress point
B
, the Mohr circle diameter
or the deviator stress increases until the failure condition
is reached at stress point
B
. However, the net confining
pressure and th
e m
atric suction remain constant throughout
the stress path
AB
. A line drawn tangent to the Mohr cir-
cles at failure (i.e., through stress points
C
,
C
1
, and
C
2
)
represents the failure envelope corresponding to the matric
suction used for the tests. The failure envelope has a slope
angle of
φ
with respect to the
σ
u
a
axis. The friction
angle appears to be essentially equal to the effective angle
of internal friction obtained from shear strength tests on sat-
urated soil specimens. The friction angle
φ
for compacted
soils commonly lies in the range of 25
◦
-35
◦
, as shown in
Table 11.1. The effect of compactive effort on the saturated
shear strength parameters
φ
and
c
for a clayey sand is illus-
trated in Fig. 11.46. The results indicate that densification
of a soil using different compaction efforts results in a soil
with differing saturated shear strength parameters; that is,
the soils should be considered as different soils.
Figure 11.47 presents the stress paths followed during
consolidated drained tests under a constant net confining
pressure and various matric suctions. The Mohr circle at
failure increases in diameter as the matric suction increases
at failure. The Mohr circle at failure is tangent to the failure
envelope corresponding to the matric suction used in the test
(e.g., at stress points
C
1
,C
2
, and
C
3
). However, stress points
C
1
,C
2
, and
C
3
do not occur at the same net normal stress.
Therefore, a line joining the stress points
C
1
,C
2
, and
C
3
will
not give the angle
φ
b
. Rather, it is suggested that the failure
envelope be extended to intersect the shear strength versus
u
a
−
−
(a)
(b)
u
w
plane to give cohesion intercepts. A line joining
the cohesion intercepts at various matric suctions gives the
angle
φ
b
.
11.6.2 Constant-Water-Content Test
The specimen is first consolidated and then sheared for CW
triaxial tests. The pore-air phase is allowed to drain while the
pore-water phase is maintained in an undrained mode. The
consolidation procedure is similar to that of the consolidated
drained test. The axis translation technique can be used to
impose matric suctions greater than 1 atm. The soil specimen
(c)
Figure 11.44
Consolidated drained tests on unsaturated silt:
(a) typical deviator stress versus strain curves; (b) water vol-
ume change versus strain relations; (c) specimen volume change
versus strain relations (after Blight, 1967).


Search WWH ::

Custom Search