Environmental Engineering Reference
In-Depth Information
2.2.3 Atterberg Limits
The shrinkage curve associated with an initially slurry soil
provides information on the consistency of the soil in terms
of gravimetric water content. The shrinkage curve starts near
the liquid state, passes through the plastic state, and into the
semisolid state and the solid state as the soil is allowed to
dry. The soil passes through the various states in response to
an increase in soil suction caused by the drying of the soil.
It is useful to understand the shrinkage curve in response
to changes in the stress state (i.e., soil suction or negative
pore-water pressures) (Fig. 2.16).
A clay soil gradually increases in shear strength as it is
dried from initial water contents above the liquid limit. The
shear strength becomes approximately 1.7 kPa at the liquid
limit of the soil (Aitkinson, 2007). Wood (1990) suggested
that the average effective stress in the soil was about 8 kPa
at the liquid limit. The matric suction continues to increase
as the water content decreases as a result of evaporation.
Most soils start to desaturate as the water content
approaches the plastic limit of the soil. The shear strength
at the plastic limit is estimated to be around 170 kPa
(Atkinson, 2007). In other words, there is approximately a
two-order-of-magnitude increase in undrained shear strength
between the liquid limit and the plastic limit of a clayey
soil (Wood and Wroth, 1978; Budhu, 2010). As the water
content of a clayey soil decreases below the plastic limit,
the volume of the soil decreases at a reduced rate while
the shear strength increases substantially. Eventually there
is no further volume change as the soil reaches its limit of
shrinkage. Further drying reduces the water content of the
soil to zero under essentially constant-volume conditions. At
the point of zero water content the soil suction approaches
about 1,000,000 kPa.
There are also zones along the shrinkage curve that bear a
relationship to zones along the SWCC for an initially slurry
soil. The SWCC allows engineers to view soil behavior from
the standpoint of stress state changes.
2.2.4 Shrinkage Curve Equation
The “shrinkage curve” for a soil is distinct from the “shrink-
age limit” of a soil. The
shrinkage limit
is the water content
corresponding to all voids being filled with water when the
soil has been dried to zero water content (and minimum
void ratio) without any external loading applied. In other
words, the shrinkage limit represents the maximum amount
of water that could be injected into a completely dried soil
without allowing any volume change. The shrinkage limit
has received limited application in routine geotechnical engi-
neering practice while the
shrinkage curve
is now proving
to be of considerable value in constructing the volume-mass
constitutive relationships for unsaturated soils. Historically,
the volume of a drying soil was measured using the mercury
immersion technique. This procedure is now discouraged
for health safety reasons. A series of caliper readings of
3.0
2.5
Liquid limit
2.0
Residual water content
1.5
Shrinkage limit
1.0
Saturation line
Plastic limit
0.5
0.0
0
20
40
60
80
100
Water content (%)
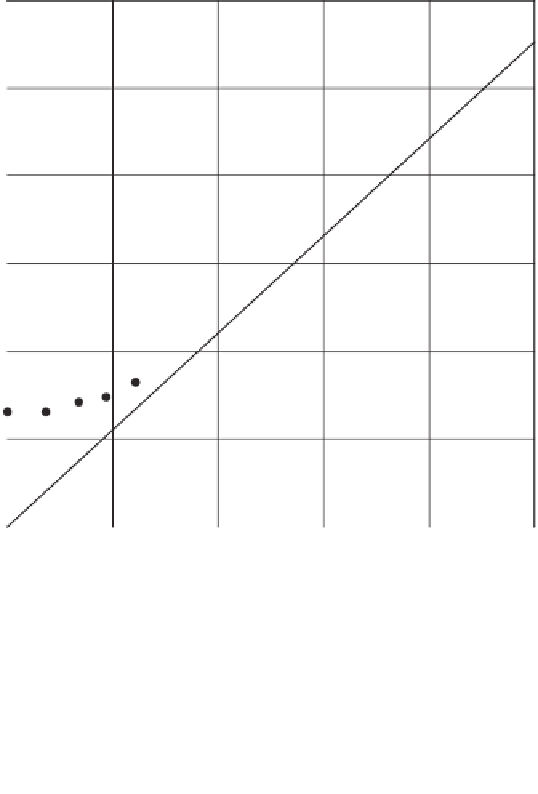
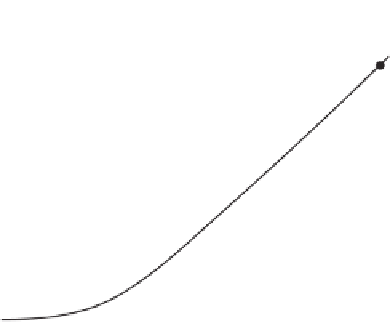
Figure 2.16
Relationship of Atterberg limits to shrinkage curve for initially slurry highly plastic
clay (data points generated).


Search WWH ::

Custom Search