Environmental Engineering Reference
In-Depth Information
102
102
102
104
104
104
106
106
110
106
108
108
108
110
110
118
118
114
114
120
112
112
118
114
112
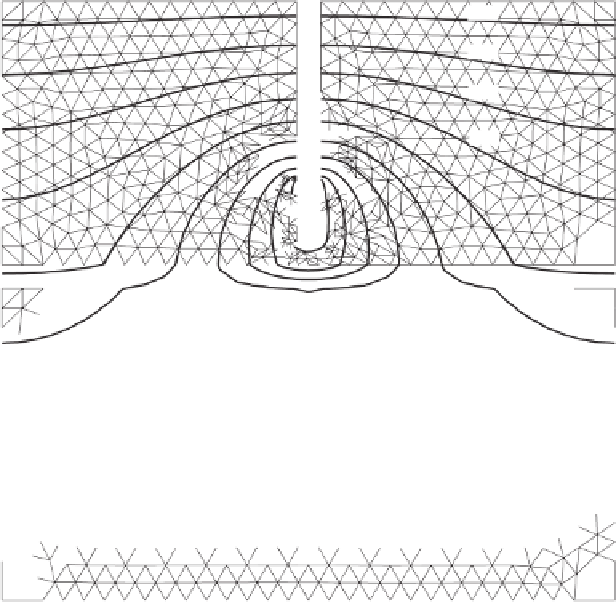
Impervious boundary
Figure 9.38
Numerical model results showing air pressure contours around trench when less
permeable layer is present below trench.
1.12
1.11
Baehr and Hult Model
Data at
z
= 2.58 m
SVAir solution
1.10
1.09
1.08
1.07
1.06
1.05
1.04
1.03
1.02
1.01
1.00
0
0.25
0.5
0.75
1
1.25
1.5
1.75
2
2.25
2.5
2.75
3
Radial distance (
r
)
Figure 9.39
Normalized pressure as function of cylindrical coordinates (
r, z
) in upper unsatu-
rated soil zone for depth
z
=
2.58 m.
depths. The square symbols represent measured values
obtained from field tests. The dashed lines indicate the
analytical solution. The computer program SVAir (M.D.
Fredlund, 2011) was used to solve the same problem and
the results are presented as solid lines on each of the
graphs. There is good agreement with both the analytical
solution and the measured field results.
9.10.7 Coupled Air Flow with Other Physical
Processes
There are numerous time-dependent analyses (i.e., transient
flow) and coupled solutions that could be used to illustrate
more complex problems that could be solved using numeri-
cal procedures. The volume or mass of air flowing through


Search WWH ::

Custom Search