Environmental Engineering Reference
In-Depth Information
0.6
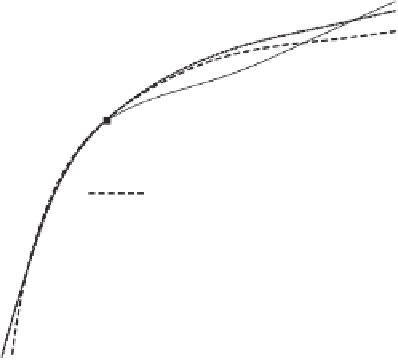
van Genuchten SWCC;
S
r
= 6.8%
Test data from Samingan et al.,
(2003)
Fredlund and Xing SWCC;
S
r
= 6.8%
van Genuchten SWCC;
S
r
= 0%
0.5
0.4
0.3
0.2
0.1
0.0
10
6
0.1
1
10
100
1000
10,000
100,000
Soil suction, kPa
(a)
1.0E-04
1.0E-05
1.0E-06
1.0E-07
1.0E-08
1.0E-09
van Genuchten SWCC +
k
a
;
S
r
= 6.8%
Test data from Samingan et al.,
(2003)
Fredlund and Xing SWCC +
k
a
;
S
r
= 6.8%
van Genuchten SWCC +
k
a
;
S
r
= 6.8%
1.0E-10
1.0E-11
1.0E-12
1.0E-13
1.0E-14
10
6
0.1
1
10
100
1000
10,000
100,000
Soil suction, kPa
(b)
Figure 9.2
SWCC and air permeability function for sand tested by Samingan et al. (2003): (a)
SWCC data and best-fit SWCC for sand; (b) measured and calculated air permeability function
for sand (after Ba-Te et al., 2005).
extreme situation where the void space is filled with air.
It is possible to visualize the soil as having a coefficient
of permeability with respect to water and a coefficient of
permeability with respect to air.
The mass rate of air flow and the concentration gradient
in the air are computed with respect to a unit area and a unit
volume of the soil:
D
a
=
transmission constant for air flow through a soil,
C
=
concentration of the air expressed in terms of
the mass of air per unit volume of soil, and
∂C/∂y
=
concentration gradient in the
y
-direction.
The negative sign in the air flow equation indicates that air
flows in the direction of a decreasing concentration gradient.
Air flow equations can similarly be written for each of the
three Cartesian coordinate directions.
The concentration of air with respect to a unit volume of
the soil can be written as
∂C
∂y
J
a
=−
D
a
(9.7)
where:
M
a
V
a
/(
1
J
a
=
mass rate of air flowing across a unit area of
the soil,
C
=
(9.8)
−
S)n


Search WWH ::

Custom Search