Environmental Engineering Reference
In-Depth Information
0.50
75
a
f
= 1,
n
f
= 2,
m
f
= 1
a
f
= 10,
n
f
= 2,
m
f
= 1
Initial
6 h
12 h
1 day
2 days
3 days
0.40
70
0.30
65
0.20
60
a
f
= 10,
n
f
= 2,
m
f
= 1
q
= 10
−
5
m/s
k
sat
= 10
−
5
m/s
0.10
55
0.00
50
10
6
0.01
1
100
10,000
−
160
−
120
−
80
−
40
0
40
Soil suction, kPa
Pore-water pressure (kPa)
(a)
0.15
a
f
= 1,
n
f
= 2,
m
f
= 1
a
f
= 10,
n
f
= 2,
m
f
= 1
75
Initial
0.5 h
1 h
2 h
4 h
8 h
12 h
70
0.10
65
60
0.05
a
f
= 100,
n
f
= 2,
m
f
= 1
q
= 10
−
5
m/s
k
sat
= 10
−
5
m/s
55
50
−
160
−
120
−
80
−
40
0
40
0.00
10
6
0.01
1
100
10,000
Pore-water pressure (kPa)
(b)
Soil suction, kPa
Figure 8.89
Comparison of water storage functions for soils with
a
f
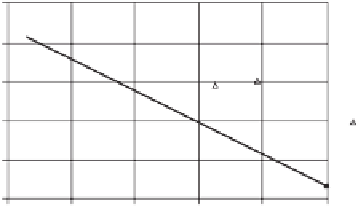
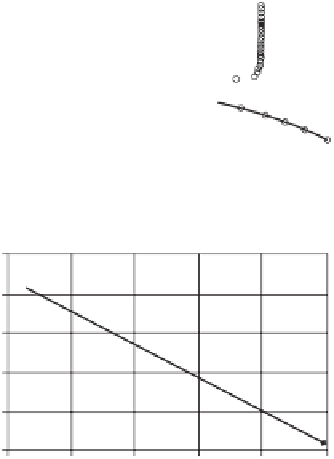
Figure 8.90
Pore-water pressure profiles in a slope (with a water
table) subjected to rainfall flux
q
=
10
−
5
m/s: (a)
a
f
=
1and
a
f
=
10.
=
10 kPa;
(b)
a
f
=
100 kPa (after Zhang et al., 2004).
Differences in the water storage functions help explain the
rate of movement of the wetting front for soils with different
air-entry values (see Figs 8.85a-8.85f). For soils with the
same coefficient of permeability and the same desaturation
rate subjected to the same magnitude of rainfall flux, the
soil with a lower air-entry value has a greater water storage
capacity than the soil with a larger air-entry value. Conse-
quently, the movement of the wetting front is much slower
for the soil with the low air-entry value. On the other hand, if
the soils have the same SWCC (i.e., the same water storage
function), the soil with a smaller saturated coefficient of per-
meability allows less infiltration than the soil with a larger
coefficient of permeability even though both soils have the
same water holding capacity. These results illustrate why
the rate of downward movement of the wetting front for a
soil with
k
s
=
8.4.7 Effect of Varying Groundwater Boundary
Conditions
The groundwater tables in soil slopes can vary significantly
depending on the imposed boundary conditions. Figures 8.90
and 8.91 show the pore-water pressure profiles when the
groundwater table is allowed to rise during infiltration. The
selected rainfall fluxes were 100 and 10% of
k
s
, respectively.
Comparing Fig. 8.90 with Fig. 8.85 for similar pore-water
pressure profiles, it can be observed that the rates of down-
ward movement of the wetting front are comparable. The
rising of the groundwater table is more obvious for the soils
with larger air-entry values because the soil has less water
storage capacity. Similar observations can be seen when
comparing Fig. 8.91 and Fig. 8.87.
The pore-water pressure profiles presented above were for
section
X-X
at the midpoint of the slope (see Fig. 8.75).
However, the pore-water pressure distribution across the
entire slope appeared to a give a similar message with regard
to the permanence of matric suction.
10
−
7
m/s is much slower than for a soil with
10
−
3
m/s (See Figs. 8.88a-8.88c).
Freeze (1969) studied the mechanism of groundwater
recharge and discharge using a one-dimensional finite dif-
ference model involving transient flow through a saturated-
unsaturated soil system. Three soils, Del Monte sand,
Rehovot sand, and Grenville silt, were used in the study.
The permeability function, water storage capacity, and
air-entry value were shown to be controlling parameters for
the pore-water pressure response of the soil. The wetting
front was shown to propagate more slowly through the
pore-water pressure profile in the Rehovot sand, which had
a larger water storage capacity, than through the Del Monte
sand and the Grenville silt.
k
s
=
8.4.8 Geotechnical Engineering Implications
Numerous research studies have been undertaken that show
the changes in pore-water pressure profiles in slopes sub-
jected to various surface moisture flux conditions. Much
has been learned about the response of the soil in the unsat-
urated soil zone to rainfall conditions, but this seems to
be where most of the studies have ended. Consequently,


Search WWH ::

Custom Search