Environmental Engineering Reference
In-Depth Information
75
75
Initial
1 h
2 h
70
70
a
f
= 1
a
f
= 5
a
f
= 10
a
f
= 20
a
f
= 50
a
f
= 100
a
f
= 200
65
65
3 h
4 h
60
60
6 h
8 h
q
= 10
−
7
m/s
k
sat
= 10
−
7
m/s
55
55
q
= 10
−
5
m/s,
k
sat
= = 10
−
5
m/s
50
50
−
160
−
160
−
120
−
80
−
40
0
40
−
120
−
80
−
40
0
40
Pore-water pressure (kPa)
(a)
Pore-water pressure (kPa)
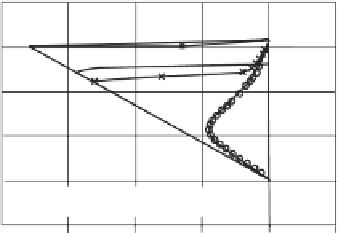
Figure 8.86
Comparison of pore-water pressure profiles for soils
with various air-entry values after 24 h of rainfall (after Zhang
et al., 2004).
75
Initial
1 h
2 h
4 h
6 h
8 h
70
65
75
60
Initial
q
= 10
−
5
m/s
k
sat
= 10
−
5
m/s
70
55
12 h
1 day
2 days
3 days
4 days
5 days
65
50
−
160
−
120
−
80
−
40
0
40
60
a
f
= 10,
n
f
= 2,
m
f
= 1
k
sat
= 10
−
5
m/s
q
= 10
−
6
m/s
Pore-water pressure (kPa)
(b)
55
75
50
−
160
−
120
−
80
−
40
0
40
Initial
1 min
2 min
3 min
4 min
6 min
8 min
70
Pore-water pressure (kPa)
(a)
65
75
60
Initial
2 h
4 h
6 h
12 h
18 h
24 h
70
q
= 10
−
8
m/s
k
sat
= 10
−
8
m/s
55
65
50
60
−
160
−
120
−
80
−
40
0
40
a
f
= 10,
n
f
= 2,
m
f
= 1
k
sat
= 10
−
5
m/s
q
= 10
−
6
m/s
Pore-water pressure (kPa)
(c)
55
50
−
0
160
−
120
−
80
−
40
40
Figure 8.88
Pore-water pressure profiles in slope subjected to the
same ratio of
q/k
sat
=
1 for soils with
a
f
Pore-water pressure (kPa)
(b)
=
100,
n
f
=
2,
m
f
=
1:
=
10
−
7
m/s and
k
sat
=
10
−
7
m/s; (b)
q
=
10
−
5
m/s and
(a)
q
k
sat
=
10
-5
m/s,
=
10
−
3
m/s and
k
sat
=
10
−
3
m/s
(c)
q
(after
Figure 8.87
Examples of pore-water pressure profiles in soil
with two air-entry values subjected to surface flux, q
=
10
−
6
m/s:
(a)
a
f
Zhang et al., 2004).
=
10 kPa; (b)
a
f
=
100 kPa (after Zhang et al., 2004).
Figure 8.90. The primary difference between the two SWCCs
is the air-entry value. The desaturation rate (i.e.,
n
f
The rainfall fluxes are assumed to be equal to the saturated
coefficient of permeability for the three cases. The pore-
water pressure profiles are similar, but the rates of
downward movement of the wetting fronts are distinct,
indicating that the rainfall infiltration can be related to the
absolute intensity of the rainfall and the soil properties.
2)
is the same for both soils, but the maximum water storage
modulus for the soil with
a
f
=
=
1 is 0.1445 while the soil with
a
f
10 kPa is only 0.0145. These values show that the desat-
uration rate
n
f
represents the slope at the inflection point of
the SWCC and is expressed on a logarithm scale of matric
suction while the water storage modulus
m
2
is expressed as
the arithmetic slope of the SWCC. The change of matric suc-
tion,
(u
a
−
=
8.4.6 Influence of Water Storage on Pore-Water
Pressure Profile
Unsaturated soil property functions corresponding to two air-
entry-values are shown in Figure 8.89. The infiltration of
water into soils with varying air-entry values is shown in
u
w
)
, is much smaller when
a
f
=
1 than when
a
f
10 because the desaturation part is in the low-matric-
suction portion for
a
f
=
=
1 and as a result it has a larger water
storage modulus.


Search WWH ::

Custom Search