Environmental Engineering Reference
In-Depth Information
75
75
Initial
1 day
10 days
20 days
40 days
50 days
Initial
2 h
6 h
12 h
18 h
24 h
70
70
65
65
60
60
55
55
a
f
= 1,
n
f
= 2,
m
f
= 1
a
f
= 50,
n
f
= 2,
m
f
= 1
50
50
−
160
−
120
−
80
−
40
0
40
−
160
−
120
−
80
−
40
0
40
Pore-water pressure (kPa)
(a)
Pore-water pressure (kPa)
(d)
75
75
Initial
1 day
2 days
3 days
4 days
5 days
6 days
70
70
Initial
1 h
2 h
4 h
6 h
8 h
65
65
60
60
55
55
a
f
= 5,
n
f
= 2,
m
f
= 1
a
f
= 100,
n
f
= 2,
m
f
= 1
50
50
−
160
−
120
−
80
−
40
0
40
−
160
−
120
−
80
−
40
0
40
Pore-water pressure (kPa)
(b)
Pore-water pressure (kPa)
(e)
75
75
Initial
1 h
2 h
3 h
4 h
6 h
70
70
Initial
1 day
2 days
3 days
4 days
65
65
60
60
55
55
a
f
= 10,
n
f
= 2,
m
f
= 1
a
f
= 200 ,
n
f
= 2,
m
f
= 1
50
50
−
160
−
120
−
80
−
40
0
40
−
160
−
120
−
80
−
40
0
40
Pore-water pressure (kPa)
(c)
Pore-water pressure (kPa)
(f)
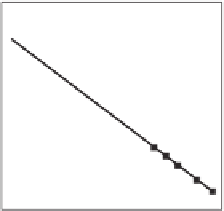
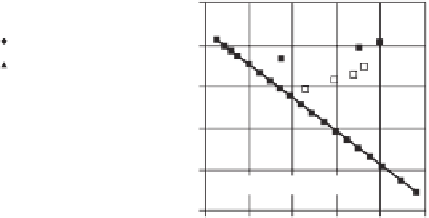
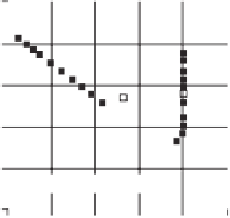
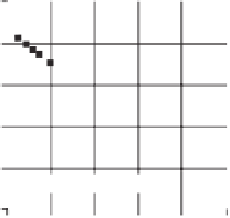
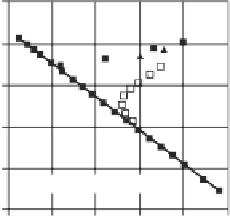
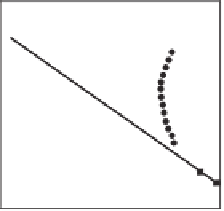
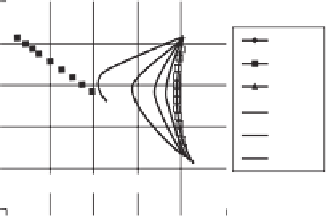
Figure 8.85
Pore-water pressure profiles for soils with various air-entry values (i.e.,
a
param-
eters) and
k
sat
=
10
−
5
m/s subjected to flux
q
=
10
−
5
m/s under transient seepage conditions:
(a)
a
f
=
1kPa,(b)
a
f
=
5kPa,(c)
a
f
=
10 kPa, (d)
a
f
=
50 kPa, (e)
a
f
=
100 kPa, and
(f)
a
f
=
200 kPa (after Zhang et al., 2004).
The gradient of pore-water pressure in the transition zone
becomes smaller as
a
f
increases (Fig 8.85). For example,
the gradient of the pore-water pressures in the transition
zone approaches infinity for soils with
a
f
<
10 kPa. Con-
versely, the wetting fronts for soils with
a
f
>
100 kPa no
longer appear as horizontal lines. According to Eq. 8.60,
the gradient of the pore-water pressure depends on the ratio
of moisture flux and the coefficient of permeability of the
unsaturated soil.
Figure 8.87 shows two examples of pore-water pressure
profiles when the rainfall flux is 10
−
6
m/s, which is 10%
of the saturated coefficient of permeability of the soils.
The most significant difference is seen in the shape of the
wetting front. For soils with
a
f
is approximately horizontal and the infiltration rate is much
greater than the unsaturated coefficient of permeability,
according to Eq. 8.61. However, for soils with
a
f
=
100, the initial coefficient of permeability in the soil is
comparable to the flux rate, and the pore-water pressure
gradient approaches zero.
8.4.5 Effect of Varying Saturated Coefficient
of Permeability
The pore-water pressure profiles for soils with the same
SWCC (i.e.,
a
f
1) but different
saturated coefficients of permeability (i.e., 10
−
7
,
10
−
5
, and
10
−
3
m/s, respectively) are shown in Figures 8.88a-8.88c.
=
100,
n
f
=
2,
m
f
=
=
10 kPa, the wetting front


Search WWH ::

Custom Search