Environmental Engineering Reference
In-Depth Information
75
75
70
70
65
65
60
60
55
55
a
f
= 50,
n
f
= 2,
m
f
= 1
a
f
= 5,
n
f
= 2,
m
f
= 1
50
50
−
160
0
Pore-water pressure (kPa)
−
120
−
80
−
40
40
−
160
0
Pore-water pressure (kPa)
(a)
−
120
−
80
−
40
40
(d)
75
75
70
70
65
65
60
60
55
55
a
f
= 10,
n
f
= 2,
m
f
= 1
a
f
= 100,
n
f
= 2,
m
f
= 1
50
50
−
160
−
120
−
80
−
40
0
Pore-water pressure (kPa)
40
−
160
0
Pore-water pressure (kPa)
−
120
−
80
−
40
40
(b)
(e)
75
75
70
70
65
65
60
60
55
55
a
f
= 20,
n
f
= 2,
m
f
= 1
a
f
= 200,
n
f
= 2,
m
f
= 1
50
50
−
160
0
Pore-water pressure (kPa)
−
120
−
80
−
40
40
−
160
0
Pore-water pressure (kPa)
−
120
−
80
−
40
40
(c)
(f)
q
/
k
sat
Hydrostatic
0.001
0.1
0.2
0.5
0.01
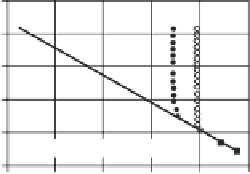
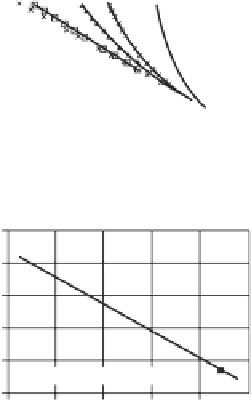
Figure 8.79
Pore-water pressure profiles in slopes with various
a
values subjected to rainfall
fluxes under steady-state conditions: (a)
a
f
=
5kPa,(b)
a
f
=
10 kPa, (c)
a
f
=
20 kPa,
(d)
a
f
=
50 kPa, (e) Parameter
a
f
=
100 kPa, and (f)
a
f
=
200 kPa (after Zhang et al., 2004).
show that it is not the absolute value of the ground surface
moisture flux, but rather the ratio of
q
/
k
s
, that influences the
pore-water pressure profiles under steady-state conditions.
Therefore, the soil response to a moisture flux is better
understood when the rainfall flux is expressed as a
percentage of the saturated coefficient of permeability.
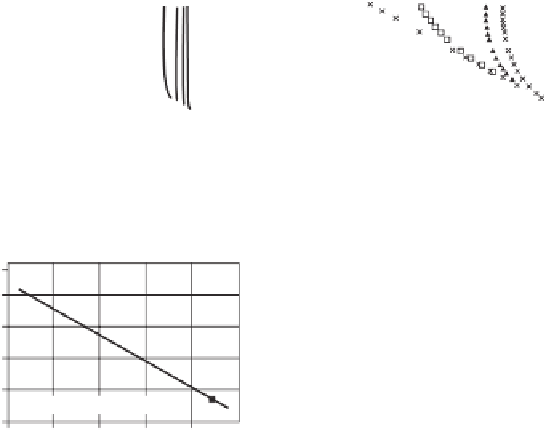
Figure 8.81 illustrates that the long-term matric suction
profiles in slopes with different
n
f
values are comparable.
However, the values of matric suction along the vertical por-
tion of the pore-water pressure profiles at the same
q
/
k
s
do
not decrease or increase monotonically with the
n
f
values.
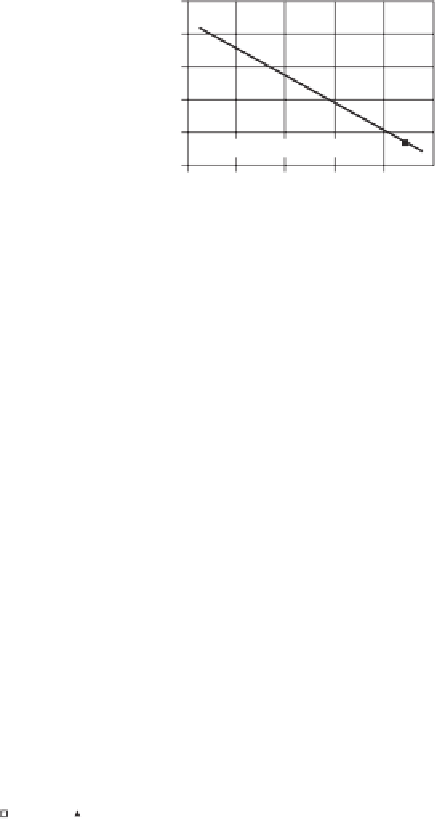
Kasim et al. (1998a) illustrated that the long-term
matric suction at ground surface could be estimated using
the coefficient-of-permeability function when the ground
surface was horizontal. The long-term matric suction
distribution under hydrostatic conditions can be represented
by a straight line with a hydraulic gradient of zero. When
a steady-state rainfall flux
q
1
is applied at the ground
surface, a hydraulic gradient of unity (or close to unity)
will be established for a portion of the unsaturated soil
profile. The long-term matric suction
u
a
−
u
w
1
associated
with a constant moisture flux
q
1
can be determined directly
from the coefficient-of-permeability function of the soil, as
illustrated in Fig. 8.82.
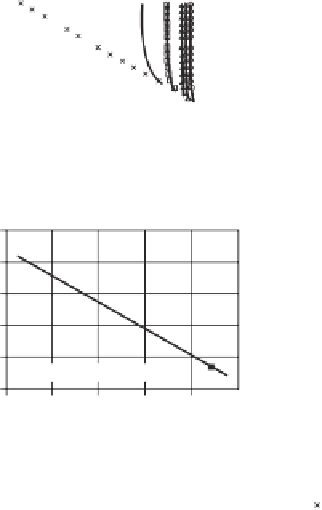
Kasim (1997) showed that the difference between the
matric suction values from numerical modeling and the esti-
mated values from the permeability functions were related
to the depth of the groundwater table. The matric suction
profile for an unsaturated soil is cut off from the constant-
matric-suction profile for an infinite thickness of unsaturated
soil. The estimated values for matric suction increase with
an increasing thickness of unsaturated soil (Fig. 8.83).


Search WWH ::

Custom Search