Environmental Engineering Reference
In-Depth Information
Degree of saturation
u
0
u
1
Pore-water pressure
S
f
S
0
1
0
New infiltration zone
h
Transition zone
h
Groundwater table
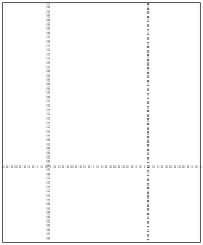
Figure 8.70
Variation of degree of saturation with depth during
rainfall infiltration (after Lumb, 1962).
and the wetted zone. Under prolonged and heavy rainfall the
depth of the wetting front,
h,
was defined as
Figure 8.71
Transient infiltration into an unsaturated soil, (mod-
ified from Sun et al., 1998).
k
s
t
n
S
f
−
h
=
S
0
(8.58)
the wetting front,
h
, corresponding to a particular elapsed
time was calculated using the following equation:
where:
k
1
−
k
0
t
k
s
=
saturated coefficient of permeability,
h
=
(8.59)
S
f
=
final degree of saturation,
θ
1
−
θ
0
S
0
=
initial degree of saturation,
where:
n
=
porosity of the soil, and
k
0
=
q
0
, initial moisture flux,
t
=
elapsed time.
k
1
=
q
1
, subsequent moisture flux,
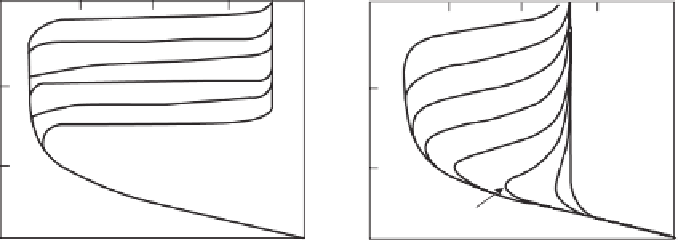
Sun et al. (1998) proposed a generalized wetting-band
equation based on the Lumb (1962) wetting-band approach
and presented the results of a series of one-dimensional
finite element analyses. Figure 8.71 shows a typical variation
of negative pore-water pressure with depth in an unsatu-
rated soil. For a given ground surface moisture flux
q
0
less
than the saturated coefficient of permeability
k
s
, the matric
suction is
(u
a
−
θ
0
=
initial volumetric water content, and
θ
1
=
subsequent volumetric water contents.
Equations 8.58 and 8.59 are similar, but the latter equation
allows for a flux change from one steady-state condition
to a new steady-state condition. The wetting-front concept
provides a simplified methodology for considering changes
in the degree of saturation (or matric suction) under a change
in rainfall conditions. However, there will not always be a
distinct change between the infiltration zone and the zone
u
w
)
0
under steady-state conditions. If the
infiltration rate is increased to
q
1
, a new infiltration zone is
formed that gradually progresses downward. The depth of
Pore-water pressure (KPa)
Pore-water pressure (KPa)
−
40
−
30
−
20
−
10
0
−
40
−
30
−
20
−
10
0
0
0
6.4 h
1 h
17.1 h
27.7 h
38.4 h
49.1 h
59.7 h
2 h
3 h
4 h
5 h
6 h
5
5
10
10
96.0 h
70.4 h
91.7 h
15
15
q
1
= 80 mm/h
q
1
= 5 mm/h
Figure 8.72
Transient infiltration at 80 mm/hr and 5 mm/hr based on a one-dimensional analysis
(after Sun et al., 1998).


Search WWH ::

Custom Search