Environmental Engineering Reference
In-Depth Information
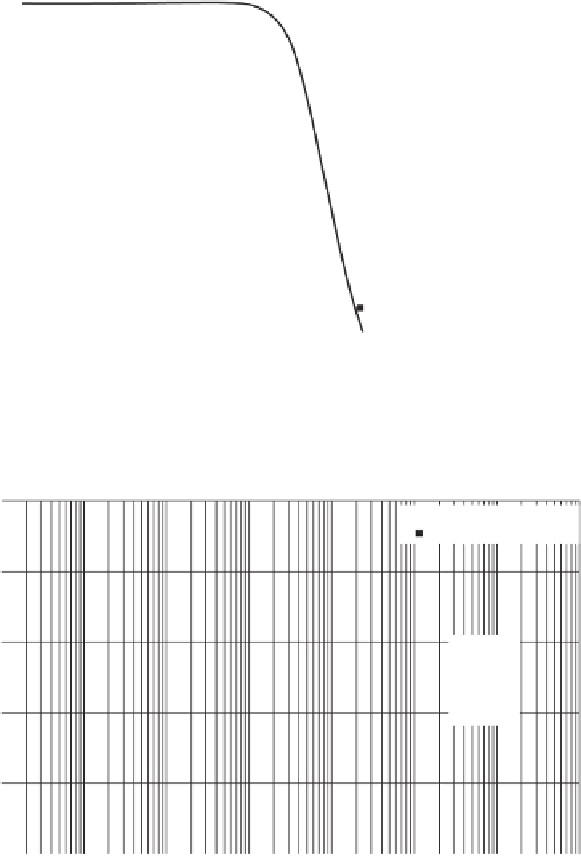
1.0
Best-fit curve
Experimental data
0.8
0.6
0.4
0.2
0
10
6
0.1
1
10
100
1000
10,000
100,000
Soil suction, kPa
Figure 8.19
Improved fit of Fredlund and Xing (1994) SWCC data for Superstition sand. (Data
from Richards, 1952.)
1
Predicted coefficient of
permeability
Measured coefficient of
permeability
0.1
0.01
0.001
0.1
1
10
100
Soil suction, kPa
Figure 8.20
Comparison of predicted and measured relative permeability function using
improved best-fit analysis of SWCC experimental data on Superstition sand. (Data from Richards,
1952.)
1.0
Best-fit curve
Experimental data
0.8
0.6
a
f
n
f
m
f
ψ
r
= 2.7
= 2.05
= 0.36
= 100
0.4
0.2
0.0
10
6
0.1
1
10
100
1000
10,000
100,000
Soil suction, kPa
Figure 8.21
Fredlund and Xing (1994) SWCC fit experimental data for Yolo light clay. (Data


Search WWH ::

Custom Search