Environmental Engineering Reference
In-Depth Information
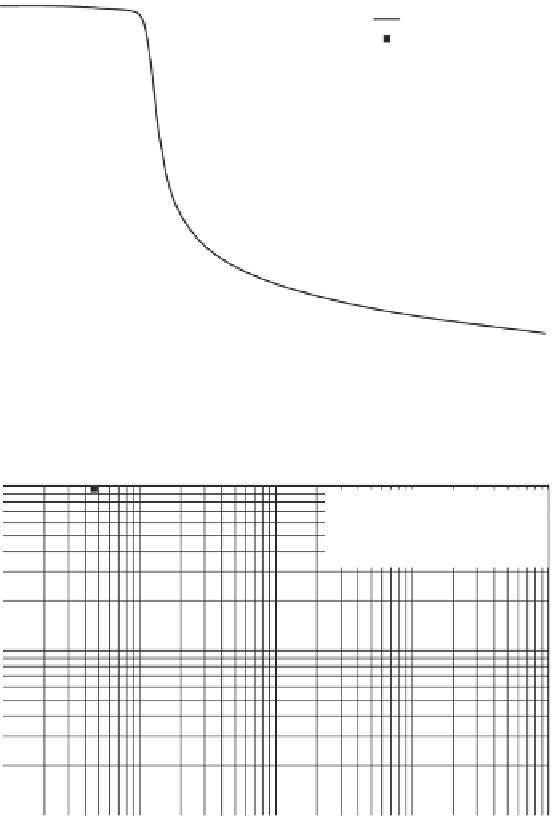
1.0
Best-fit curve
Experimental data
0.8
0.6
a
f
n
f
m
f
ψ
r
= 30
= 8.34
= 9.90
= 0.44
0.4
0.2
0
10
6
0.1
1
10
100
1000
10,000
100,000
Soil suction, kPa
Figure 8.13
Fredlund and Xing (1994) SWCC fit to experimental data for GE3. (Data from
Brooks and Corey, 1964.)
1
Predicted coefficient of
permeability
Measured coefficient of
permeability
0.1
0.01
0.1
1
10
100
1000
Soil suction, kPa
Figure 8.14
Comparison between predicted and measured relative permeability for GES. (Data
from Brooks and Corey, 1964.)
1.0
Best-fit curve
Experimental data
0.8
0.6
a
f
n
f
m
f
ψ
r
= 6.01
= 11.86
= 0.36
= 30
0.4
0.2
0
10
6
1
0.1
10
100
1000
10,000
100,000
Soil suction, kPa
Figure 8.15
Fredlund and Xing (1994) SWCC fit experimental data for Columbia sandy silt.
(Data from Brooks and Corey, 1964.)


Search WWH ::

Custom Search