Environmental Engineering Reference
In-Depth Information
As an example, the Gardner (1958a) empirical equation
with two soil parameters can be used to best fit to the data
points and thereby provide a mathematical equation to repre-
sent the permeability function. It is also possible to use other
closed-form permeability functions to best fit the generated
data (i.e., water coefficient of permeability versus soil suc-
tion). The Fredlund and Xing (1994) equation for the SWCC
can also be used along with a regression analysis to best fit
the water coefficient of permeability versus soil suction data
points. In this way, a closed-form equation can be generated
for the permeability function.
60
Start of
desaturation of clayey silt
50
Start of
desaturation
for fine sand
40
1
30
m
w
2
20
10
0
0
100
200
300
400
500
600
Matric suction (
u
a
-
u
w
), kPa
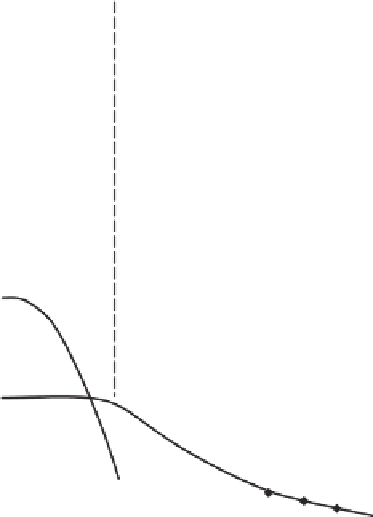
(a) Typical SWCCs
8.2.1 Designation of Amount of Water in Soil
There is a range of water contents over which liquid water
can flow through the soil. Liquid water flow becomes
smaller as the amount of water in the soil decreases. It is
somewhat difficult to ascertain a definite point at which
liquid water ceases to flow. Two primary assumptions have
been made regarding the range over which liquid water
flows through a porous medium.
Some of the earlier permeability models were based on
the assumption that liquid water flow occurred over the
range between full saturation of the soil and residual water
content (Brooks and Corey, 1964). An “effective degree of
saturation” variable was proposed that changed from 1.0 to
0.0 as the degree of saturation of the soil varied between
fully saturated conditions and residual water content con-
ditions. In other words, the designation of the amount of
water in the soil was normalized between the water content
at saturation and residual water content. Other models have
been proposed that allow the water content to vary from
the water content at full saturation and zero water content.
In other words, the water content is rendered dimensionless
by dividing any water content by the saturation water con-
tent. In this case, the dimensionless water content can once
again range from 1.0 to 0.0. Ebrahimi-Birang et al. (2004)
presented research results that suggested that liquid water
flow appeared to cease at some point beyond the residual
water content.
When the entire water content range is referenced to the
saturated water content, the amount of water in a soil can
be written in a dimensionless form that is equivalent to the
degree of saturation provided the volume change of the soil
structure is negligible as soil suction changes:
10
-4
Saturation coefficient of
permeability (fine sand)
10
-5
10
-6
10
-7
Saturation coefficient of
permeability (clayey silt)
10
-8
10
-9
10
-10
0
100
200
300
400
500
600
Matric suction (
u
a
-
u
w
), kPa
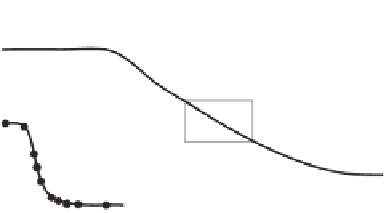
(b) Typical water permeability function
Figure 8.1
Typical relationship between SWCCs and estimated
permeability functions for sand and clayey silt.
utilize an integration procedure along the SWCC, starting
from saturated soil conditions.
“Correlation” models recognize that there is an apparent
correlation between aspects of the SWCC and the permeabil-
ity function. The apparent correlation then uses an additional
soil parameter to relate the SWCC to the water permeability
function for a particular soil type. The correlation procedure
was used by Leong and Rahardjo (1997a) to generate a water
phase permeability function from the SWCC. The additional
soil parameter for the permeability function was estimated
from a correlation with the classification properties of soils.
In “regressions” models, a series of coefficient-of-
permeability data points may be available as a result of
either laboratory permeability testing or an estimations
technique that calculates coefficients of permeability. For
example, it is possible to use the Fredlund et al., (1994)
statistical model to generate a series of data points cor-
responding to a range of soil suction values. However,
there is no closed-form representation of the data points
because of the integration form for the permeability model.
Consequently, after the data points have been generated
using the Fredlund et al. (1994) permeability model, it
is useful to best fit the data points using a regression or
best-fit analysis.
θ
θ
s
=
V
w
/V
t
V
w
d
=
V
v
/V
t
=
V
t
=
S
(8.1)
where:
d
=
dimensionless water content,
S
=
degree of saturation,
V
w
=
volume of water in the soil specimen,
V
v
=
volume of void in the soil specimen, and
V
t
=
total volume of the soil specimen.


Search WWH ::

Custom Search