Environmental Engineering Reference
In-Depth Information
where:
Value
Q
B
=
flux passing through section
B
from
t
1
to
t
2,
Q
A
=
flux passing through section
A
from
t
1
to
t
2
,
which is assumed to be zero during the cap-
illary rise process, and
W
B
−
A
=
water storage change between section
B
and
section
A
from
t
1
to
t
2
.
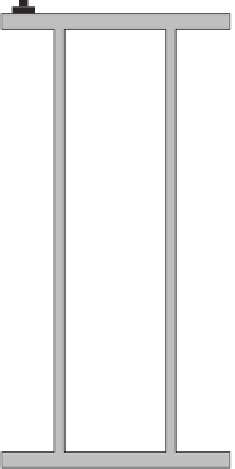
Tensiometer
Soil
The water storage
W
B
−
A
can be calculated as
h
A
h
A
Theta-probe
θ
h, t
2
Adh
θ
h, t
1
Adh
W
B
−
A
=
−
h
B
h
B
(7.74)
where:
θ(h,t)
=
volumetric water content distribution function,
Acrylic disk
with holes
A
=
cross-sectional area of the soil column,
t
=
time,
=
h
section height from the bottom of the column,
h
B
=
height at section
B,
and
h
A
=
height at section
A
.
Water
Figure 7.45a
shows
that
in a
short
time period
Figure 7.42
Column apparatus used for wetting-front advancing
column tests (after Li et al., 2009).
t
(i.e.,
t
2
−
t
1
) the wetting front advances a distance of
h
(i.e., height difference between
F
1
and
F
2
). If the water
content contour is assumed to advance smoothly during the
time interval, then the water content distribution function
can be written as follows
time and is recorded as shown in Fig. 7.45b during the cap-
illary rise process. Figure 7.45a shows that at time
t
1
the
wetting front reaches section
F
1
and at time
t
2
the wetting
front reaches section
F
2
. The flux passing through section
B
between two time intervals can be calculated as
θ (h, t
+
t)
=
θ (h
−
h, t)
(7.75)
and the suction distribution function can be written as
Q
B
=
W
B
−
A
+
Q
A
ψ
(
h, t
+
t
)
=
ψ
(
h
−
h, t
)
(7.73)
(7.76)
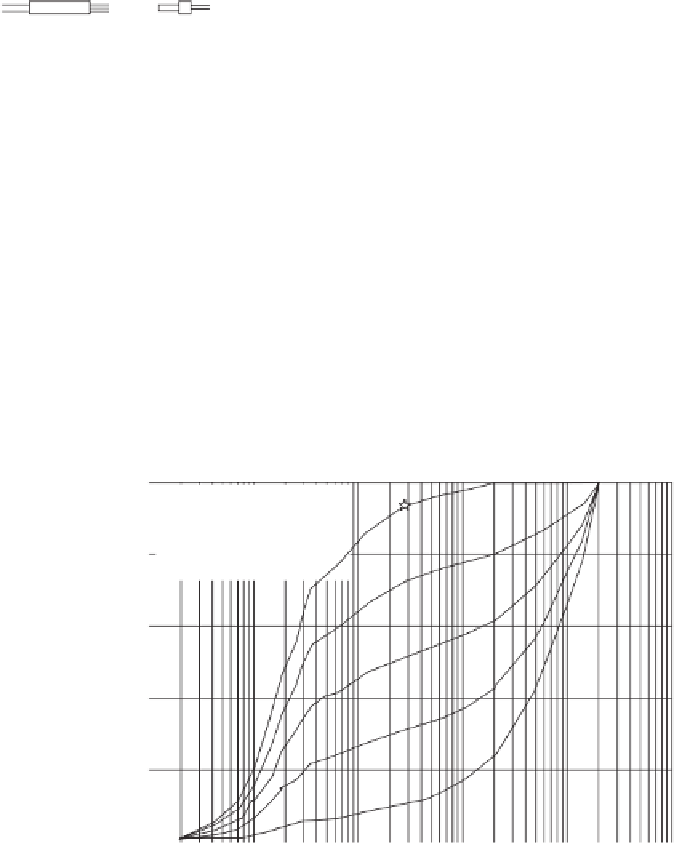
100
GW-GM with sand
SM with gravel
SC with gravel
Sandy ML
CL with sand
80
60
40
20
0
0.001
0.01
0.1
1
10
100
Particle diameter, mm
Figure 7.43
Grain-size distribution curves for colluvial soils used in wetting-front advancing
column tests (after Li et al., 2009).


Search WWH ::

Custom Search