Environmental Engineering Reference
In-Depth Information
37.4 to 38.1
◦
C during the experiment. Consequently, ther-
mal transfer in the soil column was not a dominant term in
the coupled modeling of SVFlux and SVHeat.
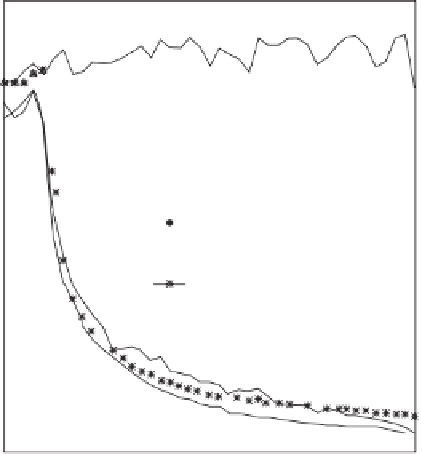
Actual evaporation calculations based on the Wilson-
Penman model (Wilson et al., 1994), and the limiting
function (Wilson et al., 1997a) model most closely match
experimental data. The experimental-based (Wilson et al.,
1997a) model results slightly underpredict the measured AE.
There was a slight overprediction of AE in the first 5
days. The overprediction appears to come from the over-
prediction of relative humidity at the soil surface. There
should not be a significant decrease in relative humidity
until the soil suction at the soil surface is larger than about
3000 kPa. However, the sand soil will go past the resid-
ual water content well below a suction of 3000 kPa. Under
these conditions there appears to be a surface resistance to
evaporation that is more dominant (Alvenas and Jansson,
1997; Lee and Pielke, 1992; Kondo and Saigusa, 1992).
An adjustment factor was introduced to compensate for the
vapor pressure calculations at ground surface and to improve
numerical stability. The adjustment factor appears to range
from 0 to 2. It is anticipated that the adjustment factor will
vary for different soils with the largest values applicable for
coarse-grained soils.
Figure 6.47 presents the measured air temperature and
the temperature at the soil surface that is observed during
the experiment (Wilson, 1990). The soil surface tempera-
tures calculated during each of the numerical simulations are
also presented. The predicted temperature at the soil surface
shows reasonable agreement with the measured values.
There is some difference between the predicted and
measurement values of temperature in the first 5 days when
using the uncoupled (or quasi-coupled) Wilson-Penman
9.0
8.0
7.0
Measured PE
Measured AE, column A
(Wilson, 1992)
Simulation by Wilson (1990)
SVFlux simulation
Limiting function (1997)
SVFlux simulation
Wilson-Penman (1994)
SVFlux simulation
Experimental-based
Eq. AE (1997)
6.0
5.0
4.0
3.0
2.0
1.0
0.0
0
10
20
30
40
Time, day
Figure 6.45
Comparison of the measured evaporation rates to
predicted evaporation rates using uncoupled moisture movement
models.
evaporation. The coupled and uncoupled results were also
similar.
The similarity between the coupled and uncoupled model
results may be due to the fact that the ambient air temper-
ature did not undergo significant change during the experi-
ment. The temperatures were recorded to have changed from
9.0
8.0
40
Measured PE
Measured AE, column A
(Wilson, 1992)
Simulation by Wilson (1990)
SVFlux simulation
Limiting function (1997)
SVFlux simulation
Wilson-Penman (1994)
SVFlux simulation
Experimental-based
Eq. AE (1997)
7.0
38
6.0
36
Measured air temperature
Measured surface temperature
SVFlux simulation
Wilson-Penman (1994)
SVFlux simulation
Limiting function (1994)
SVFlux simulation
experimental-based
Eq. AE (1997)
SVFlux and SVHeat simulation
Wilson-Penman (1997)
SVFlux and SVHeat simulation
Limiting function (1994)
SVFlux and SVHeat simulation
experimental-based
Eq. AE (1997)
5.0
34
4.0
32
3.0
30
2.0
28
1.0
26
0.0
0
10
20
30
40
24
0
10
20
30
40
Time, day
Time, day
Figure 6.46
Comparison of measured evaporation rates to
predicted evaporation rates using coupled moisture movement
models.
Figure 6.47
Comparison of predicted soil surface temperatures
and measured soil temperatures.


Search WWH ::

Custom Search